


Training
New Training Available: Assortment Plan Defaults
Head over to Toolio Academy to get a quick walkthrough of Assortment Plan Defaults and start building assortments faster with reusable templates!
Merchandise Planning
Ability to Pin Scenario
We’ve now released the pinned scenario feature in the MP module. Now, when a user clicks the pin on a Scenario name, the opened view loads that specific scenario, not the scenario previously saved to the view. The UX mirrors Dataset pins exactly.

Assortment Planning
Enhanced Gallery View for Reporting
Overview
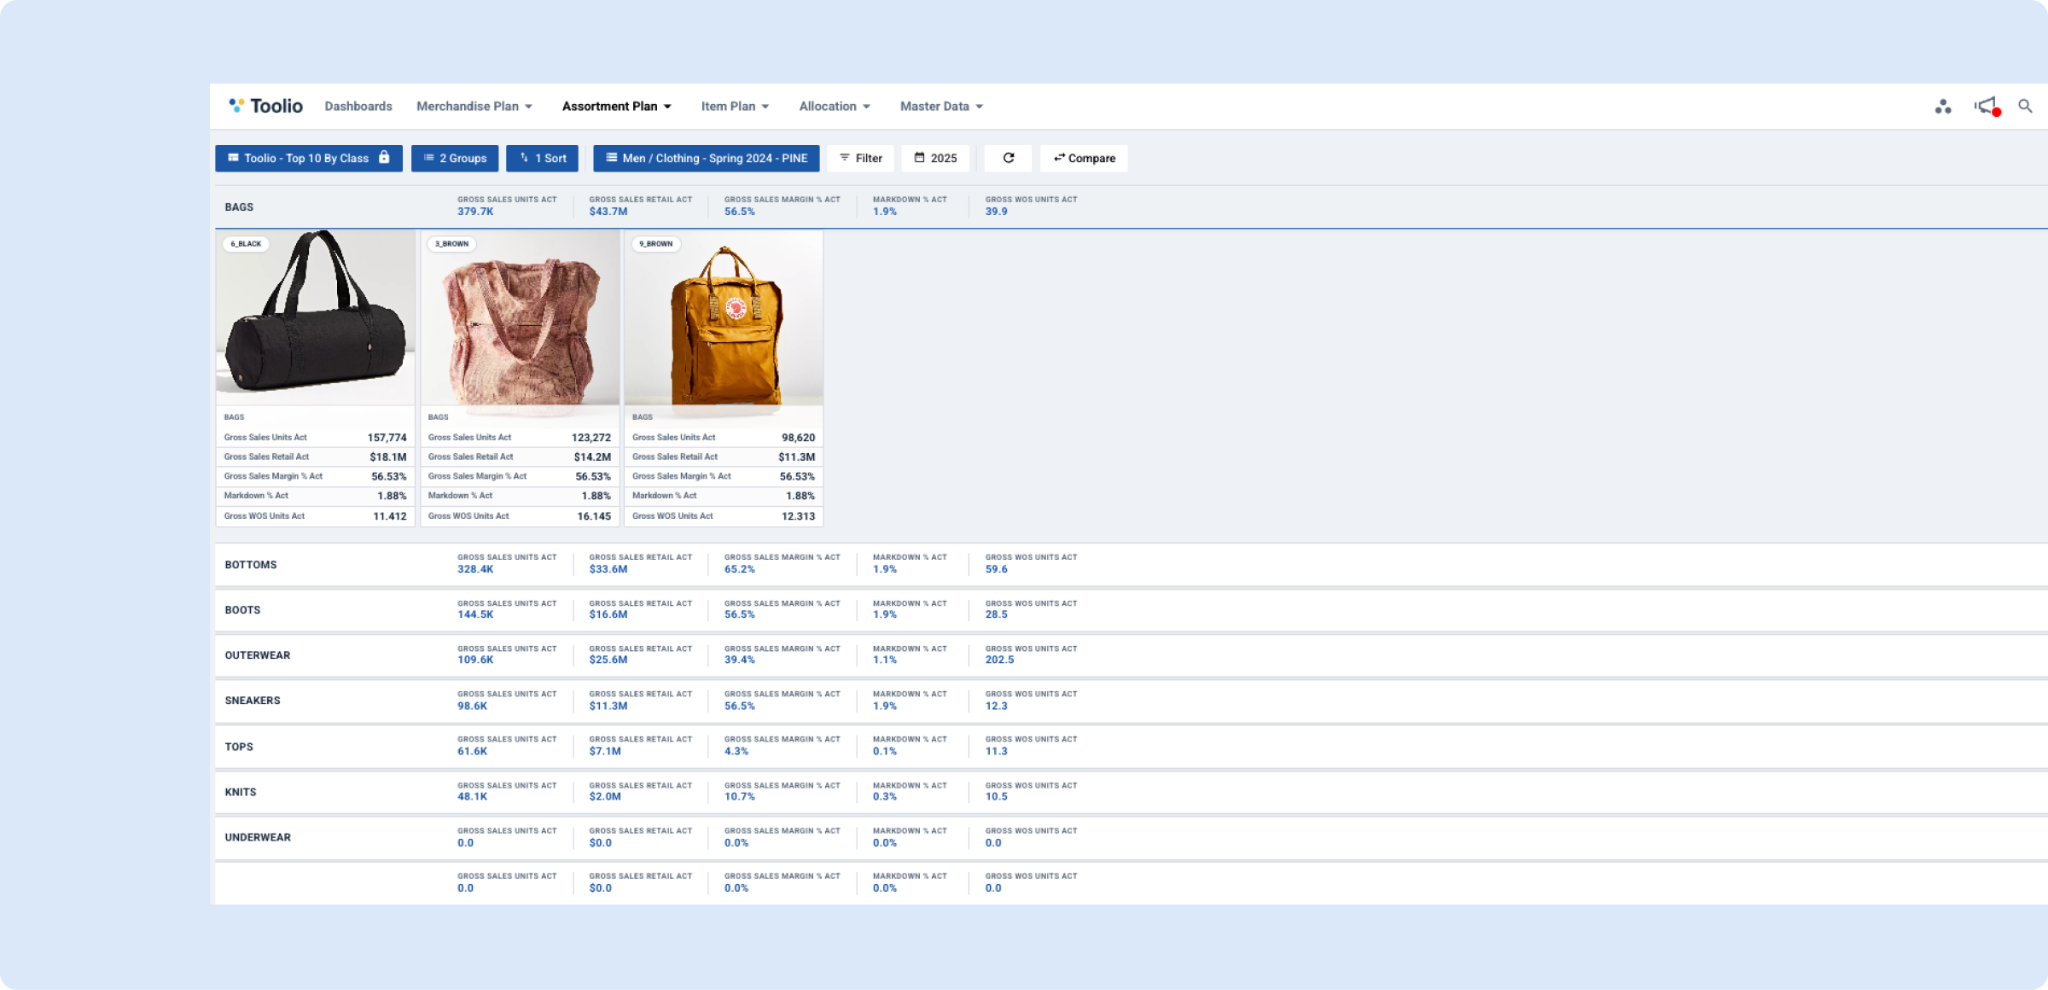
We've redesigned the gallery view in the reporting section to provide a more intuitive and visually appealing way to browse and analyze your data.
Key Benefits
Improved Visual Experience
- Cleaner card design - Cards now have a more modern, streamlined appearance that makes it easier to scan through your data
- Better image presentation - Product images are displayed more prominently with improved sizing and positioning
- Enhanced visual hierarchy - Important information like product titles and identifiers are now more clearly distinguished
Faster Data Analysis
- Metrics on aggregations - When viewing grouped data, aggregated metrics are now displayed directly in the group headers, giving you instant insights into performance at a glance without needing to expand each group
- Clearer information display - Product details and metrics are presented in a more scannable format, reducing the time needed to find specific information
What's Next
This redesign is one of many improvements we're planning for the gallery view experience. We're continuously working to make your data analysis faster, more intuitive, and more powerful. We'd love to hear your feedback on these changes and any ideas you have for future enhancements!
New Curve Fitting Algorithm for Rationalization
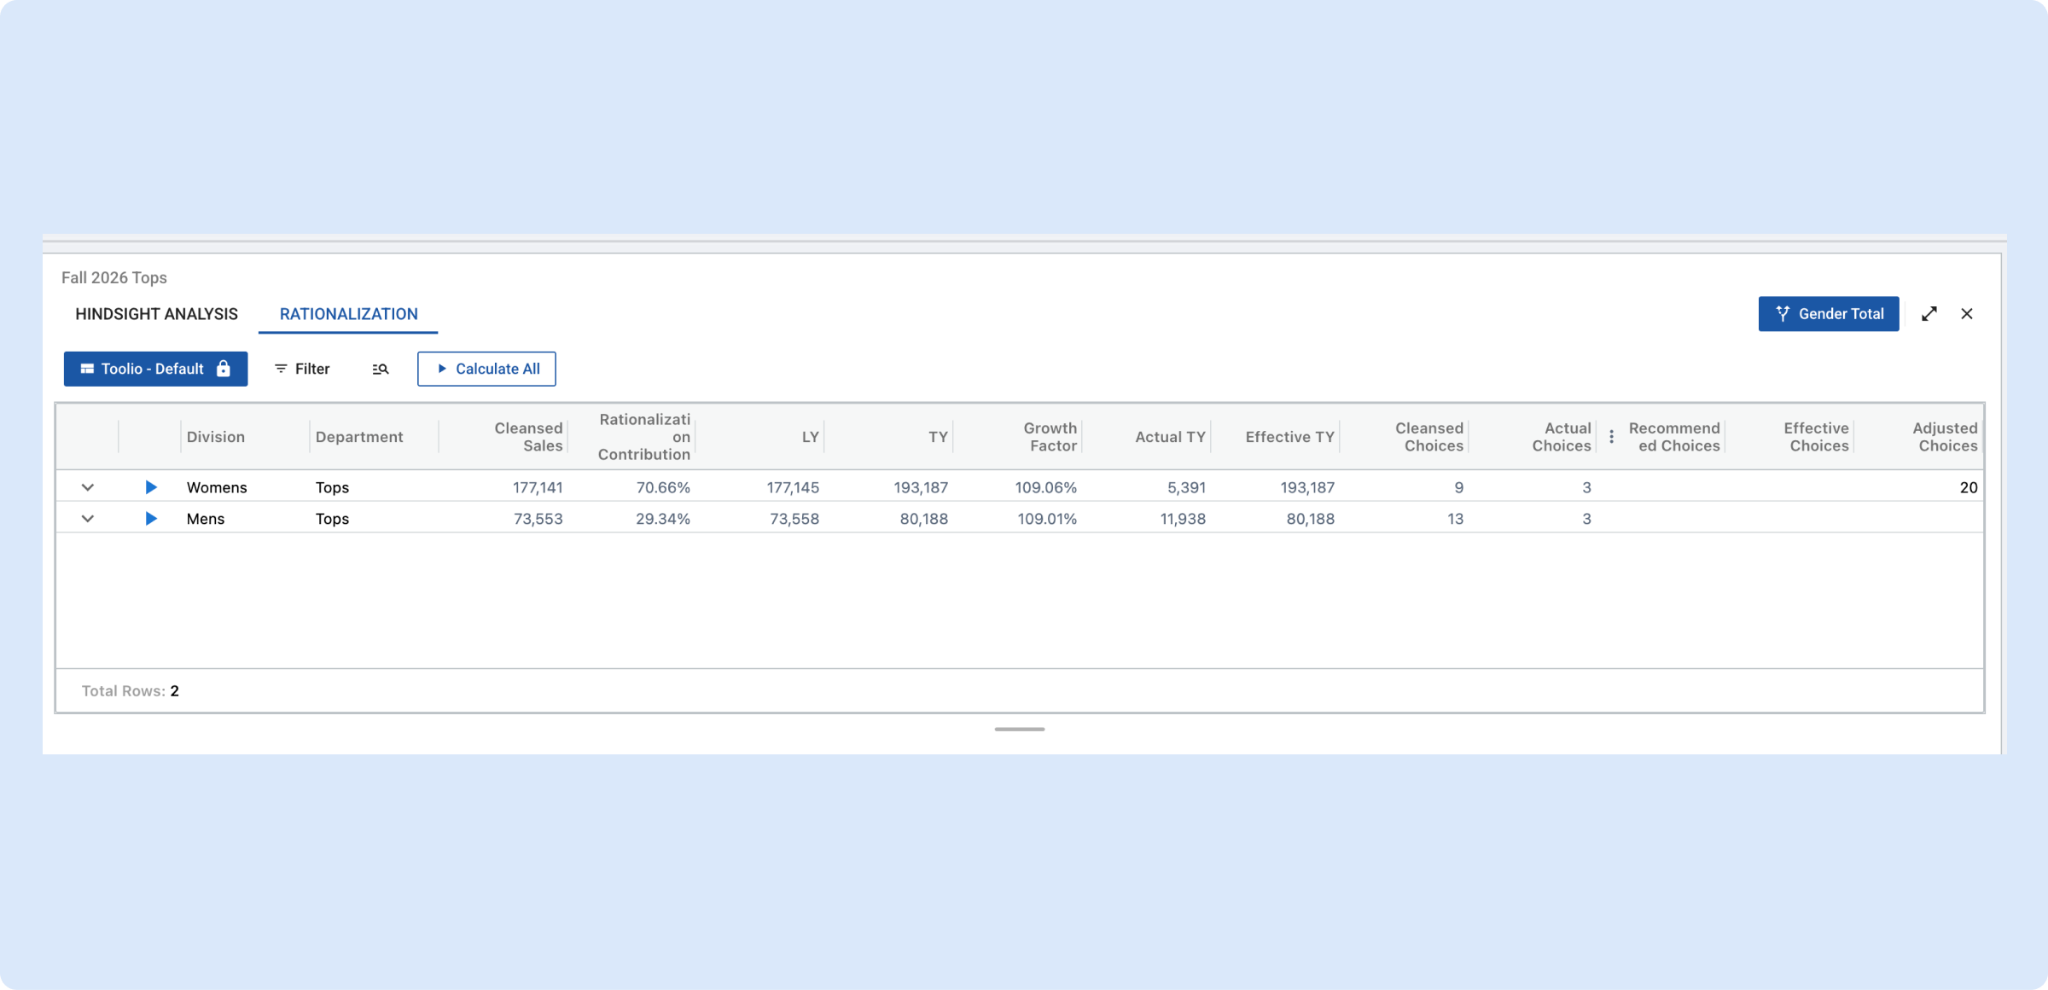
We’ve upgraded the Rationalization model with a new curve fitting approach to improve accuracy and reduce manual tuning.
What changed
- Curve tournament: the model now tests multiple diminishing-return curve families (e.g., exponential, power, hyperbolic, logistic variants) and automatically selects the best fit using AIC.
- Non-linear least squares fitting: instead of forcing the curve through the first/last points, we fit the full distribution to reduce over/under-estimation.
- Smarter extension & contraction behavior: improved tail handling without the “trimming” artifact, with a hard stop on extreme extensions.
- No more width-depth slider: assortment width is now driven by a minimum ROS threshold (more consistent and less manual).
- Optional target choice count: users can force an exact number of choices when needed.
What you’ll notice
- More stable recommendations across clusters/seasons
- Better alignment between modeled curves and planned “actual” choices (actual choices are assimilated and locked, then the remainder is rescaled to hit the productivity target)
- “Calculate all” CTA that triggers the curve fitting API for all partitions in the list.
👉 Read more about Rationalization
Assortment Plan Defaults
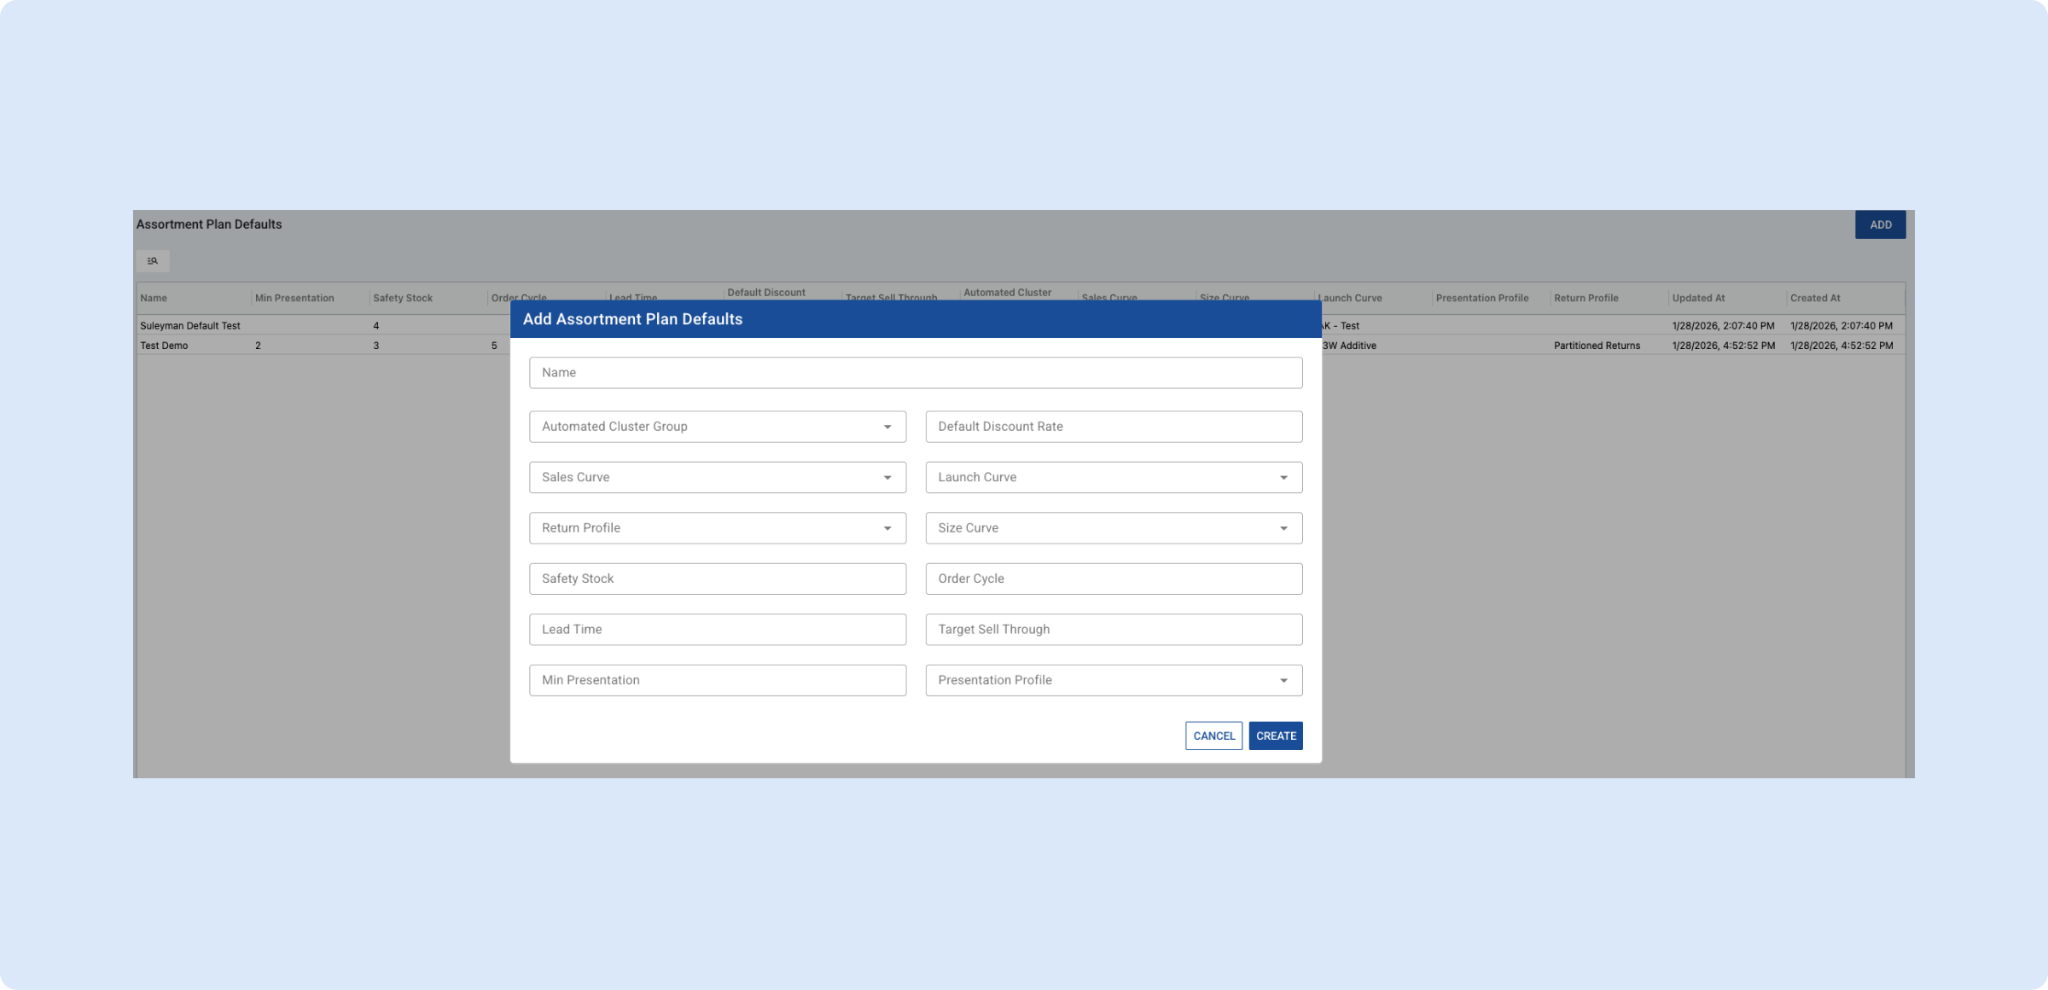
Assortment Plan Defaults are now available, giving planners a faster and more consistent way to start assortment planning. Teams can create and manage reusable default sets with key planning attributes like curves, receipt planning and forecasting attributes then apply them when creating new assortments or choices across workflows such as Style Bank and Compare mode. Defaults act as a smart starting point, while imports, user edits, and existing choices remain untouched, ensuring flexibility without disrupting in-progress plans. This update reduces manual setup, improves consistency, and keeps planners firmly in control.
Filtering on Async Task Status and Last Execution Time
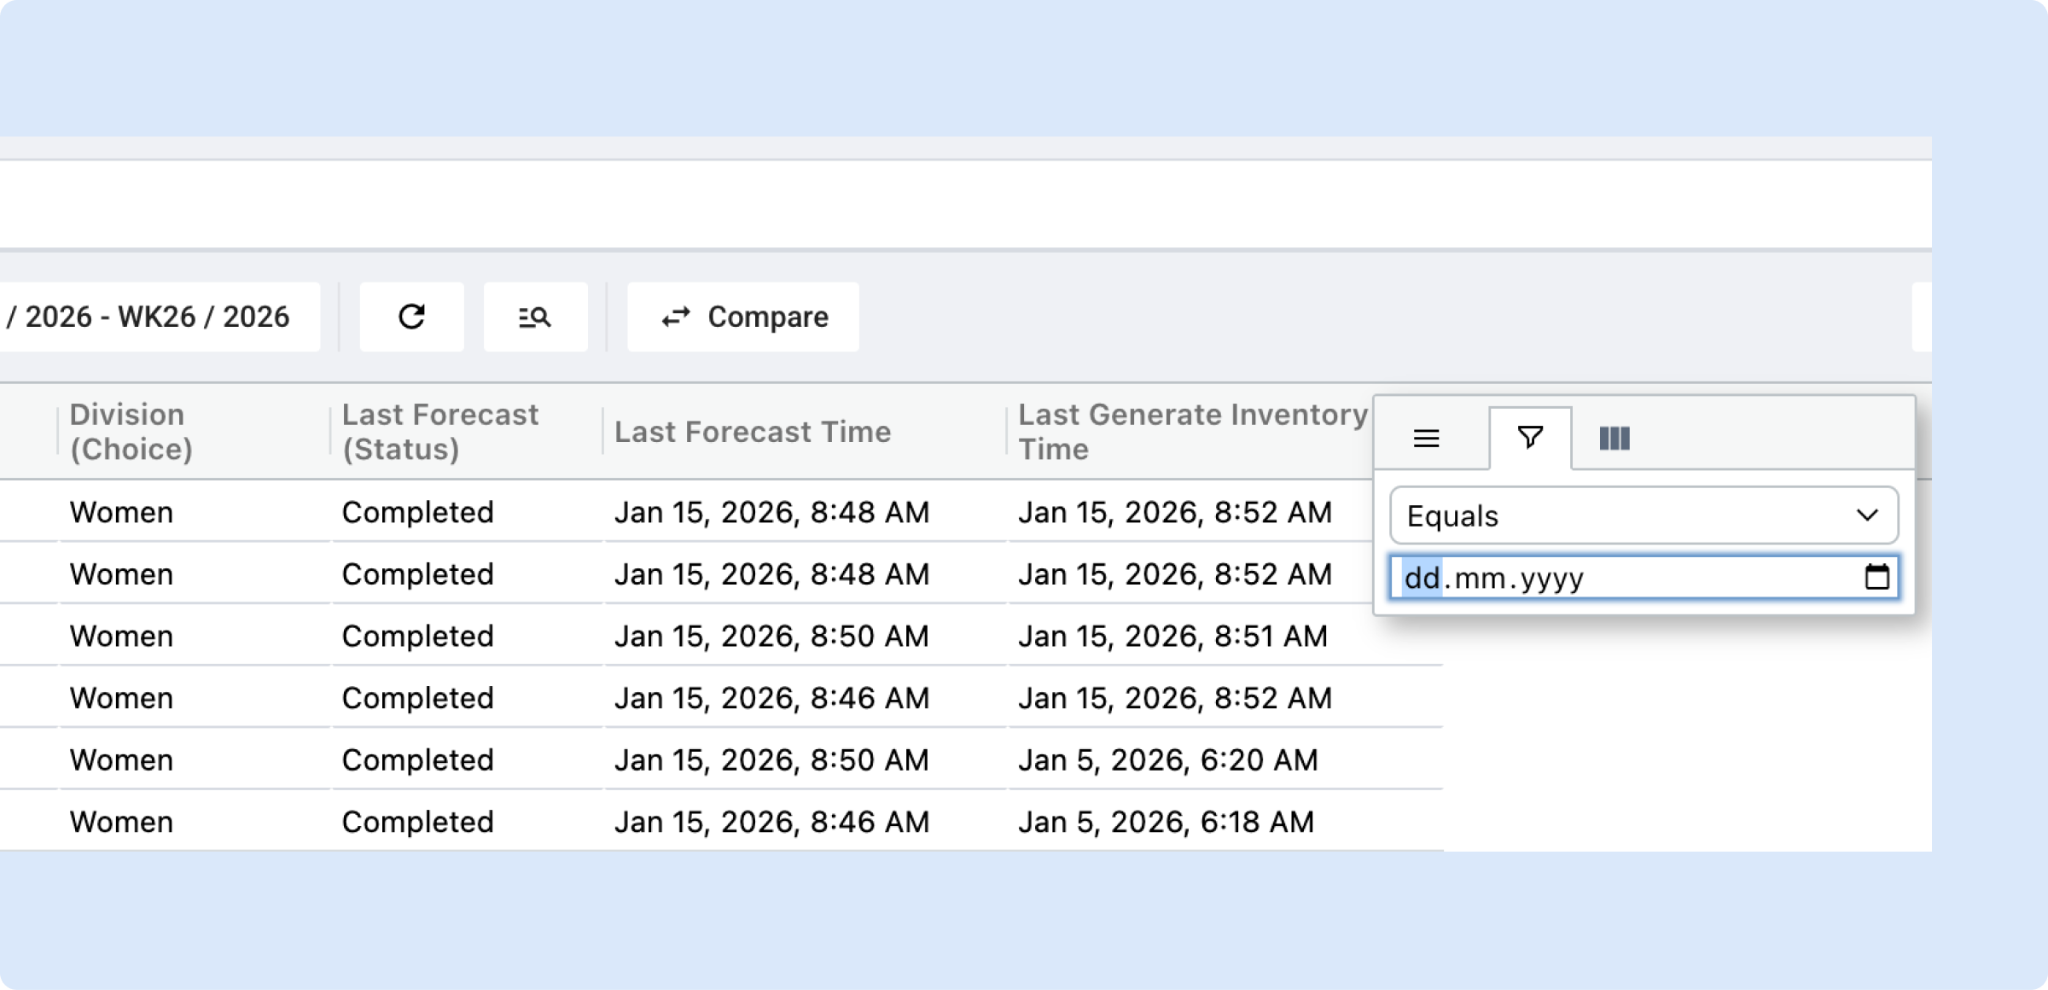
You can now surface async task status and last execution time directly in the main grid as columns. These attributes can be added from the attribute picker and viewed alongside your existing data, making it easier to spot what’s running, what’s stuck, and what needs attention.
Once added, these columns fully support ui-grid filtering and sorting, so teams can quickly narrow down records and prioritize work based on task health and recency.
Notes:
- Filtering and sorting are available via ui-grid filters only.
- Toolbar filters are not supported for async task attributes.
This brings critical operational signals front and center, helping teams focus on what matters most directly on the grid.
Allocation
✨ New: Quickly jump to the right Allocation Strategy from your Allocation plan
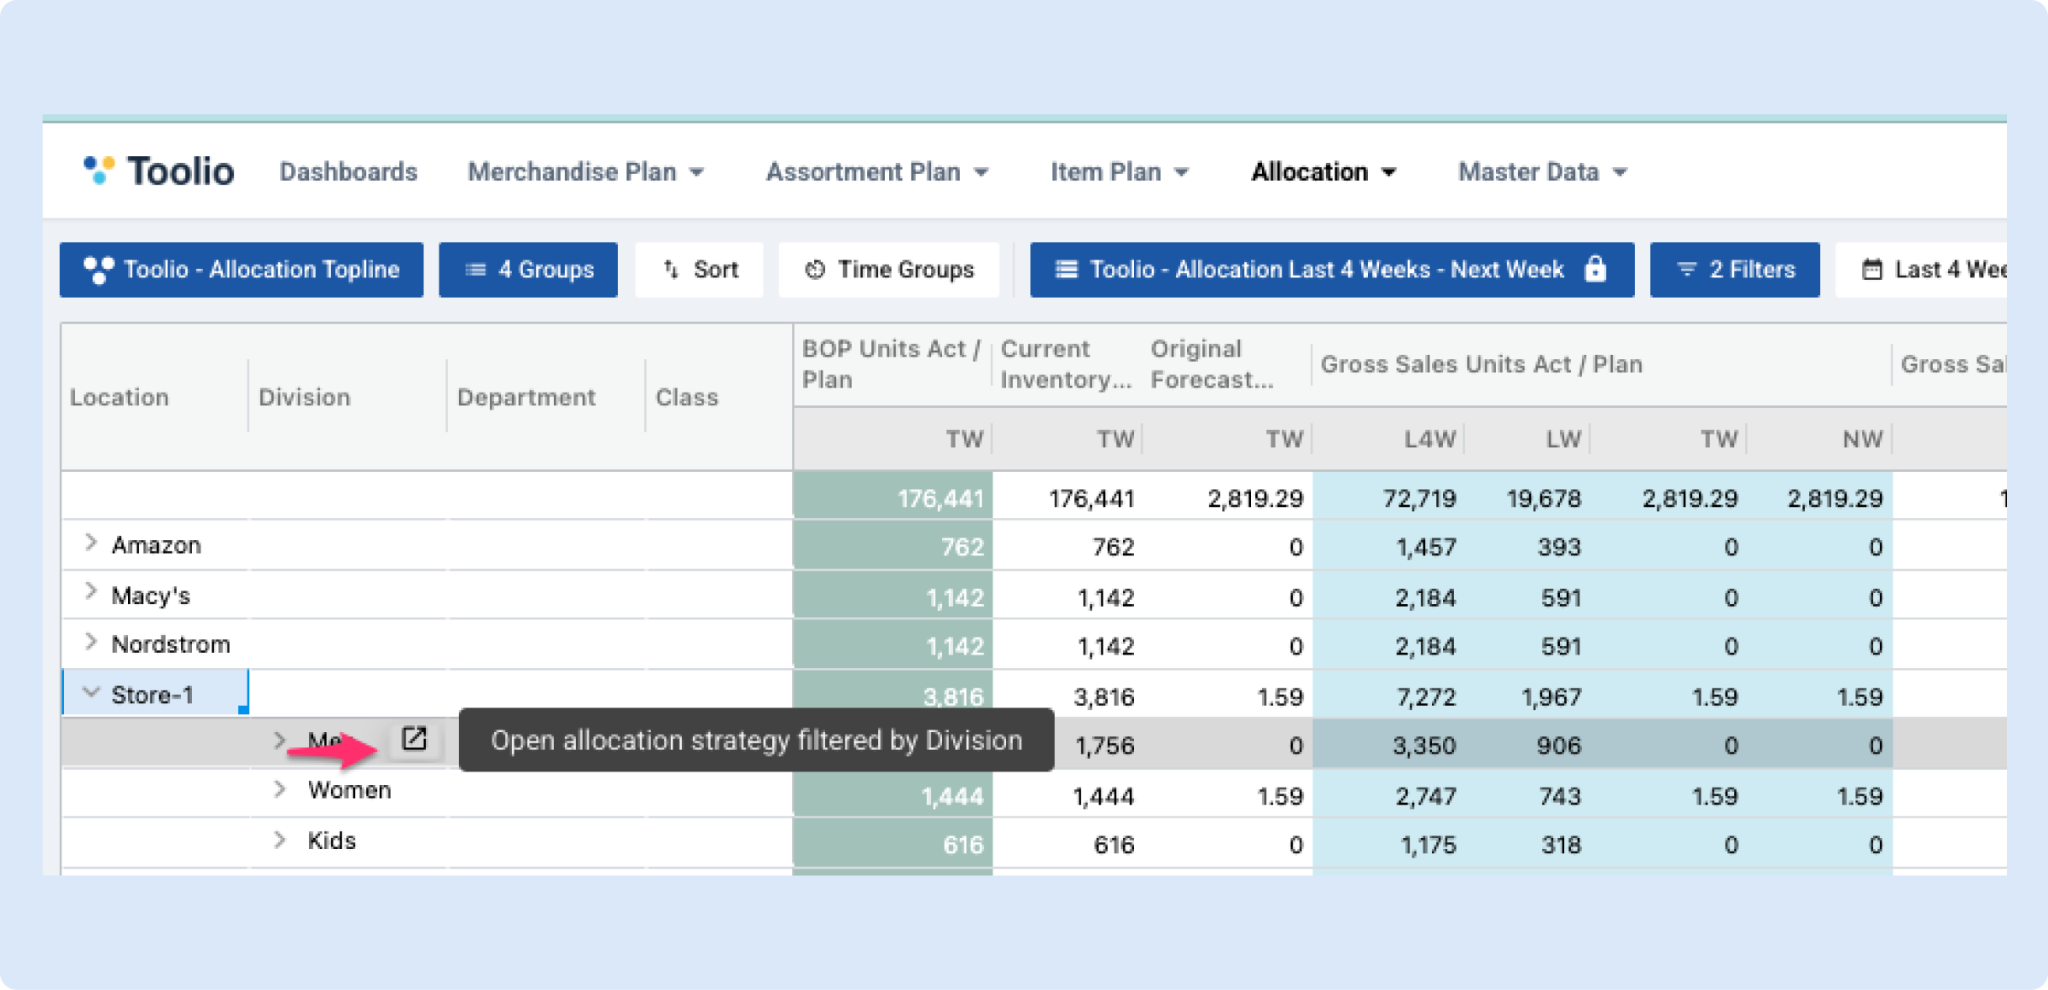
You can now open the exact Allocation Strategy you need directly from your Allocation plan, without having to go searching.
How it works
- In your Allocation plan, hover over certain product or variant details
- You’ll see a small “deep-link” icon
- Click it to open the Allocation Strategies page automatically filtered to match what you clicked
Why this is helpful
- Move faster while reviewing allocations
- Avoid manual searching across strategies
- Instantly confirm what strategy applies to a specific item
Example use cases
- Validate a strategy while reviewing a plan - You’re in an Allocation plan and want to double-check which strategy applies to a specific product. Click the icon and you’ll land on the matching strategy instantly.
- Investigate an unexpected allocation - If a recommendation looks too high or too low, jump directly to its Allocation Strategy. Review the inputs to understand what’s driving the allocation, then adjust those drivers as needed.
📊 Sales Curves: Visualization
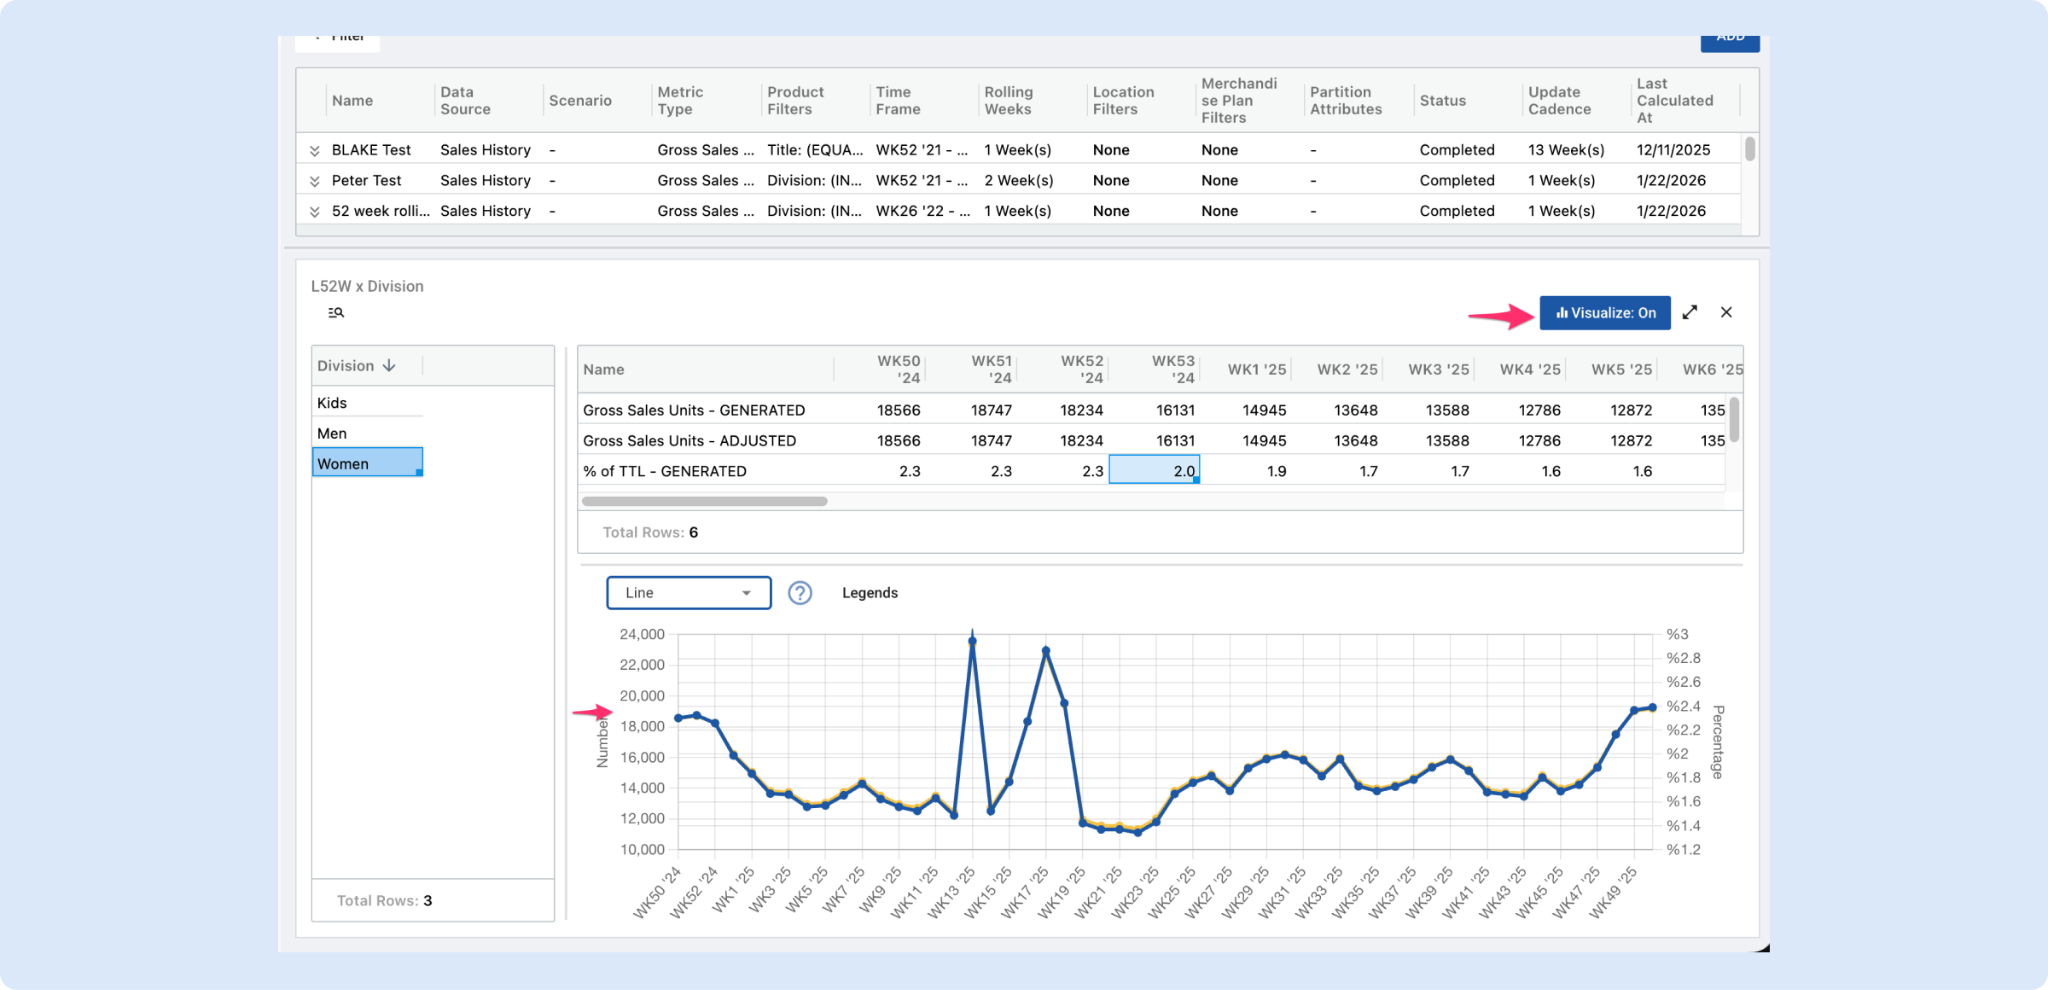
We’ve added interactive visualization directly within Sales Curves, making it easier to analyze and validate curve behavior without leaving the page.
Users can now:
- Visualize spreads instantly with a single click
- See trends over time directly alongside the grid
- See impact of adjustments on the curve
The new split-view layout allows planners to continue editing while simultaneously viewing a live chart, making it much faster to spot anomalies, validate builds, and build confidence in curve decisions.
Customize your Allocation Strategy Overrides View
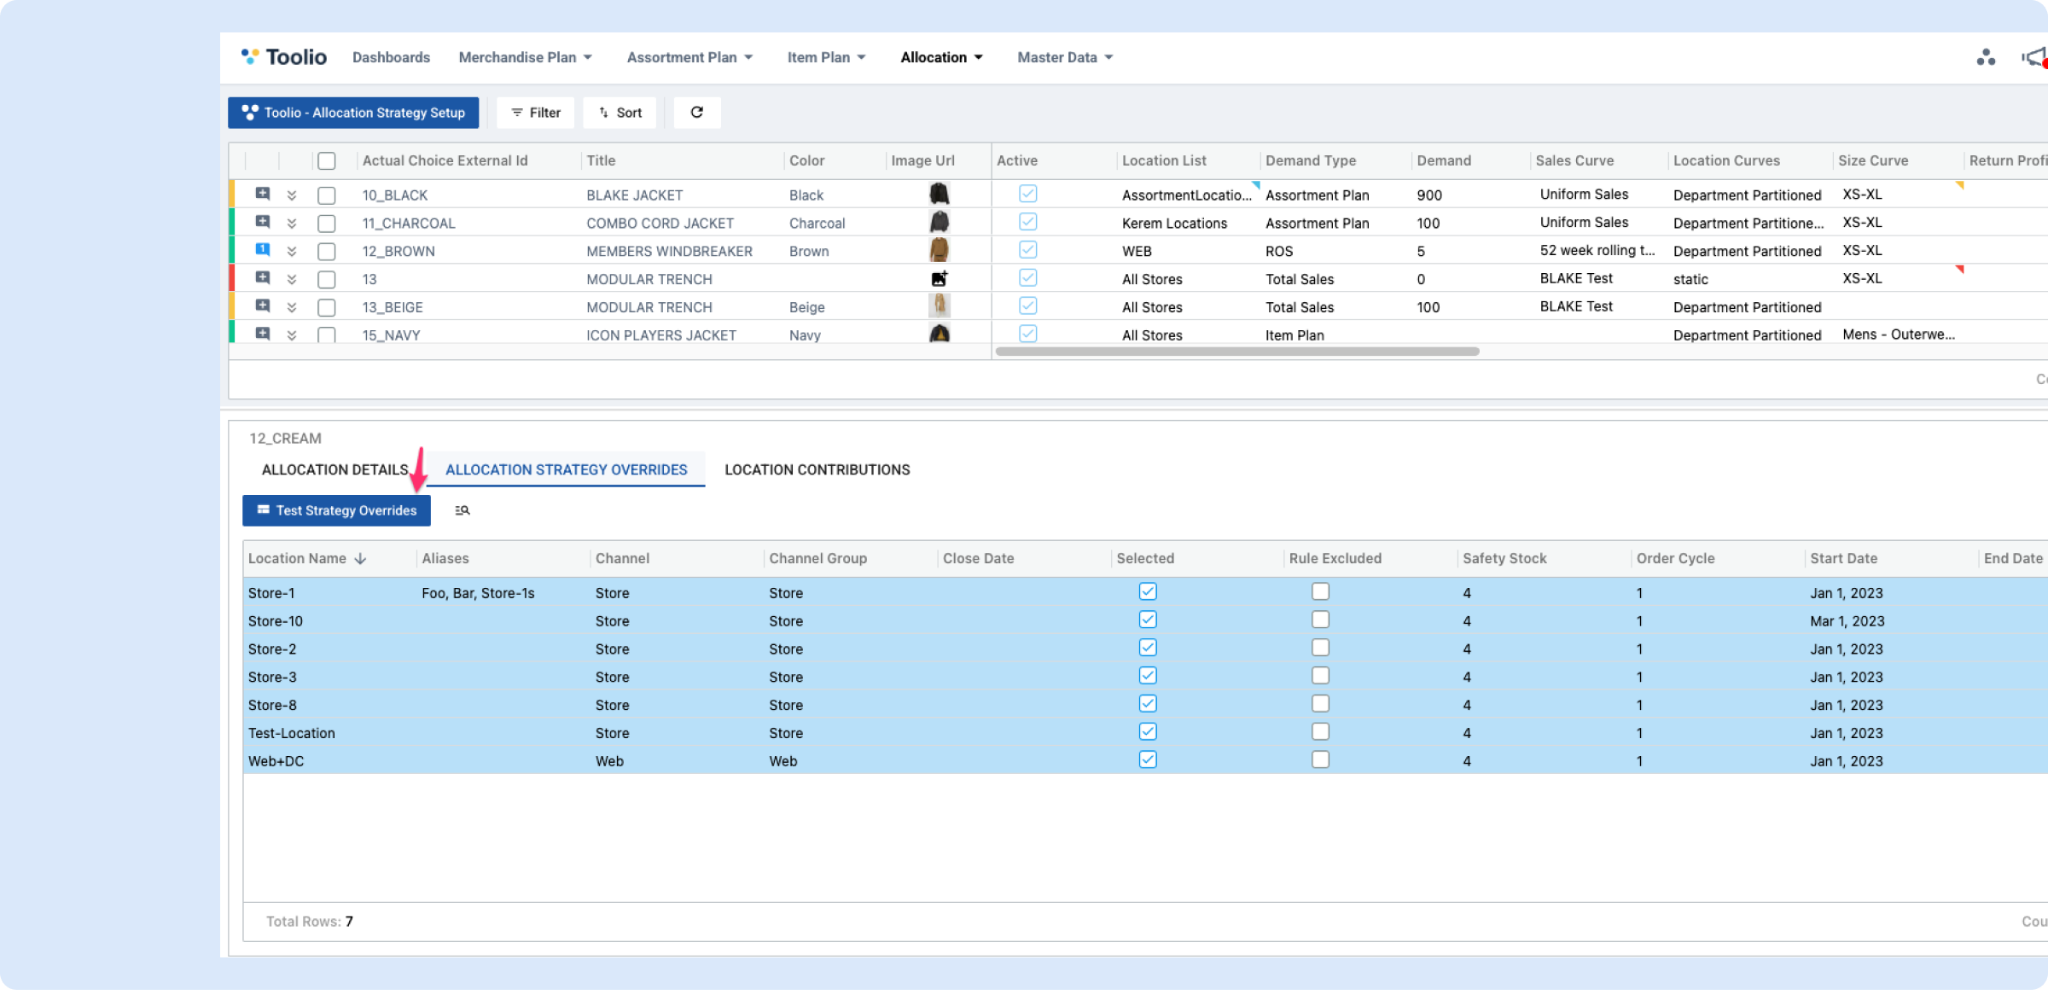
We’ve made the Allocation Strategy Overrides screen much more flexible and easier to work with.
You can now:
- Add location-specific attributes as columns (so you can see the exact context you need right in the grid)
- Filter and sort using those additional fields
- Save and reuse grid layouts with full view management:
This brings the Overrides screen in line with the same view + customization experience available in other parts of Toolio (like Presentation Profiles), making it faster to review and manage overrides at scale.
Number of Locations as an Attribute on Allocation Strategy
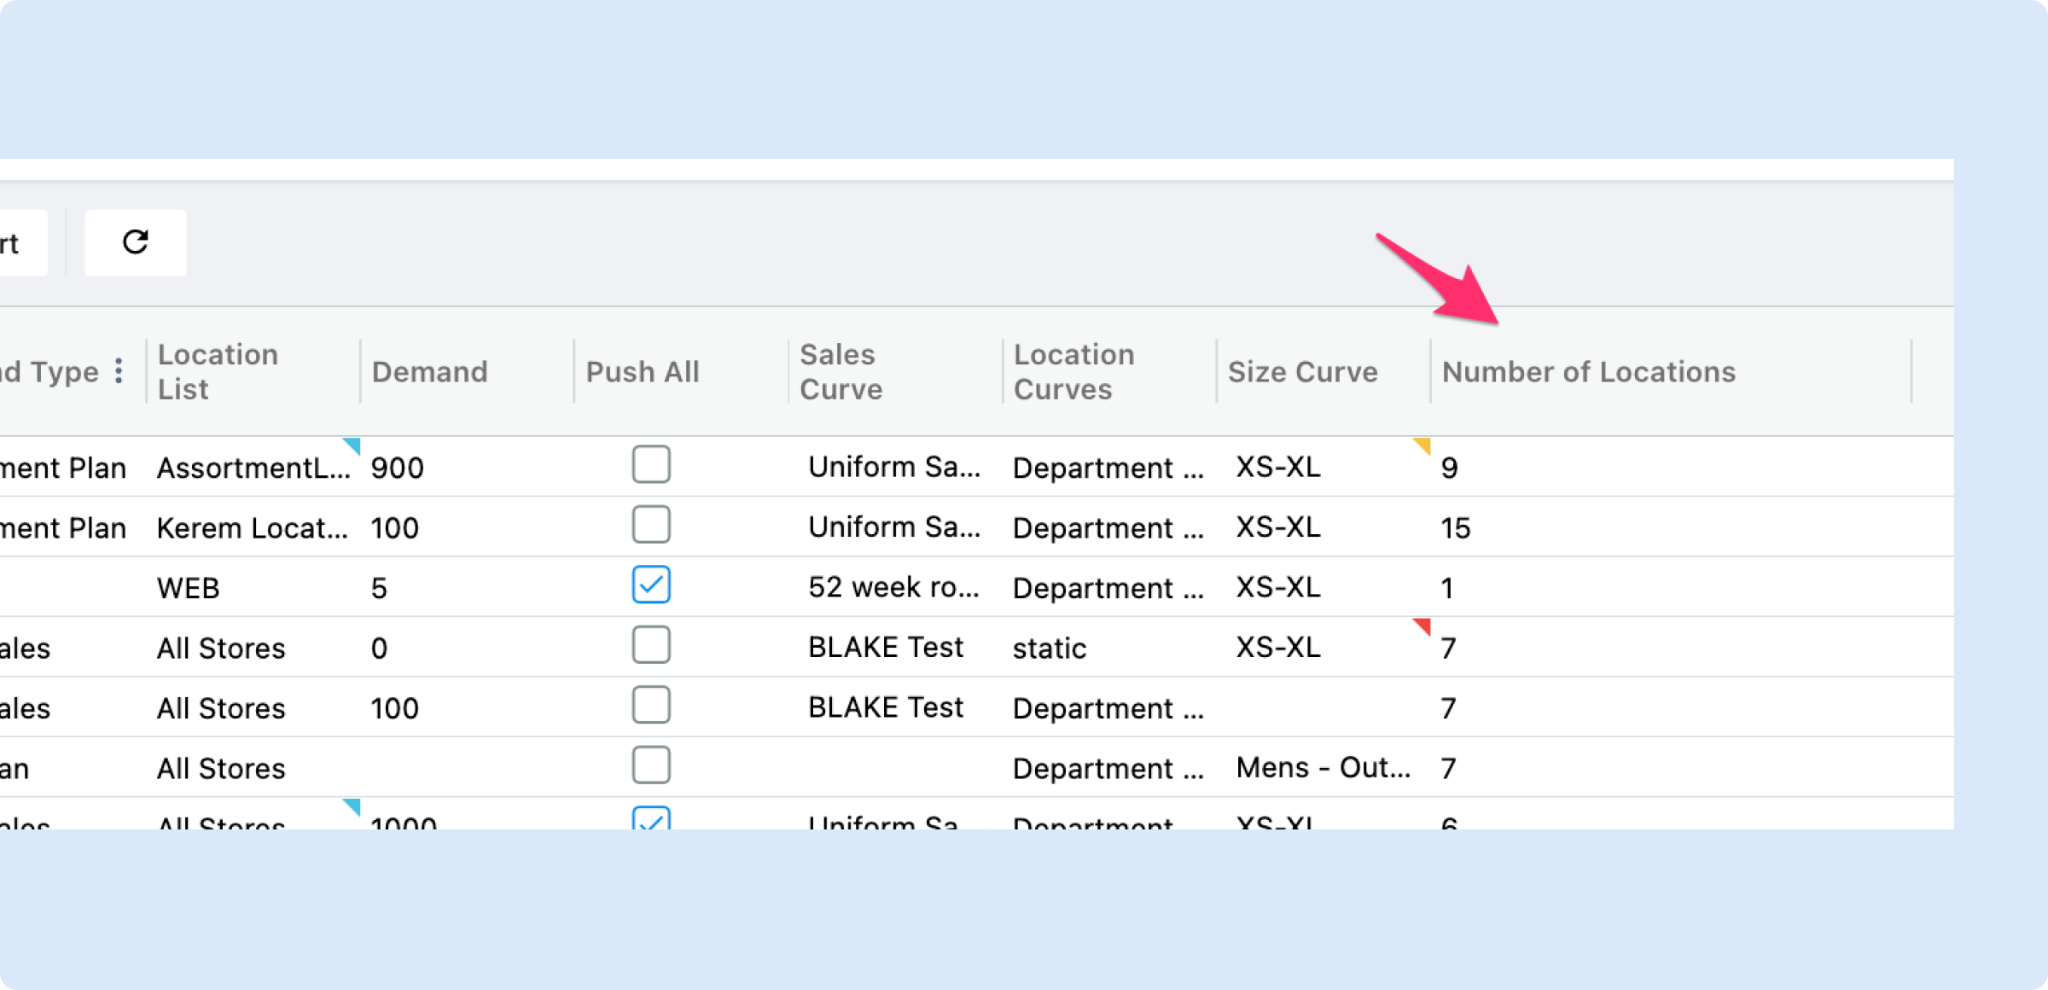
Allocation strategies now have the Number of Locations to allocate to at a glance, giving merchants and planners immediate visibility into a strategy’s store coverage so they can compare, prioritize and act faster.
General Platform Updates
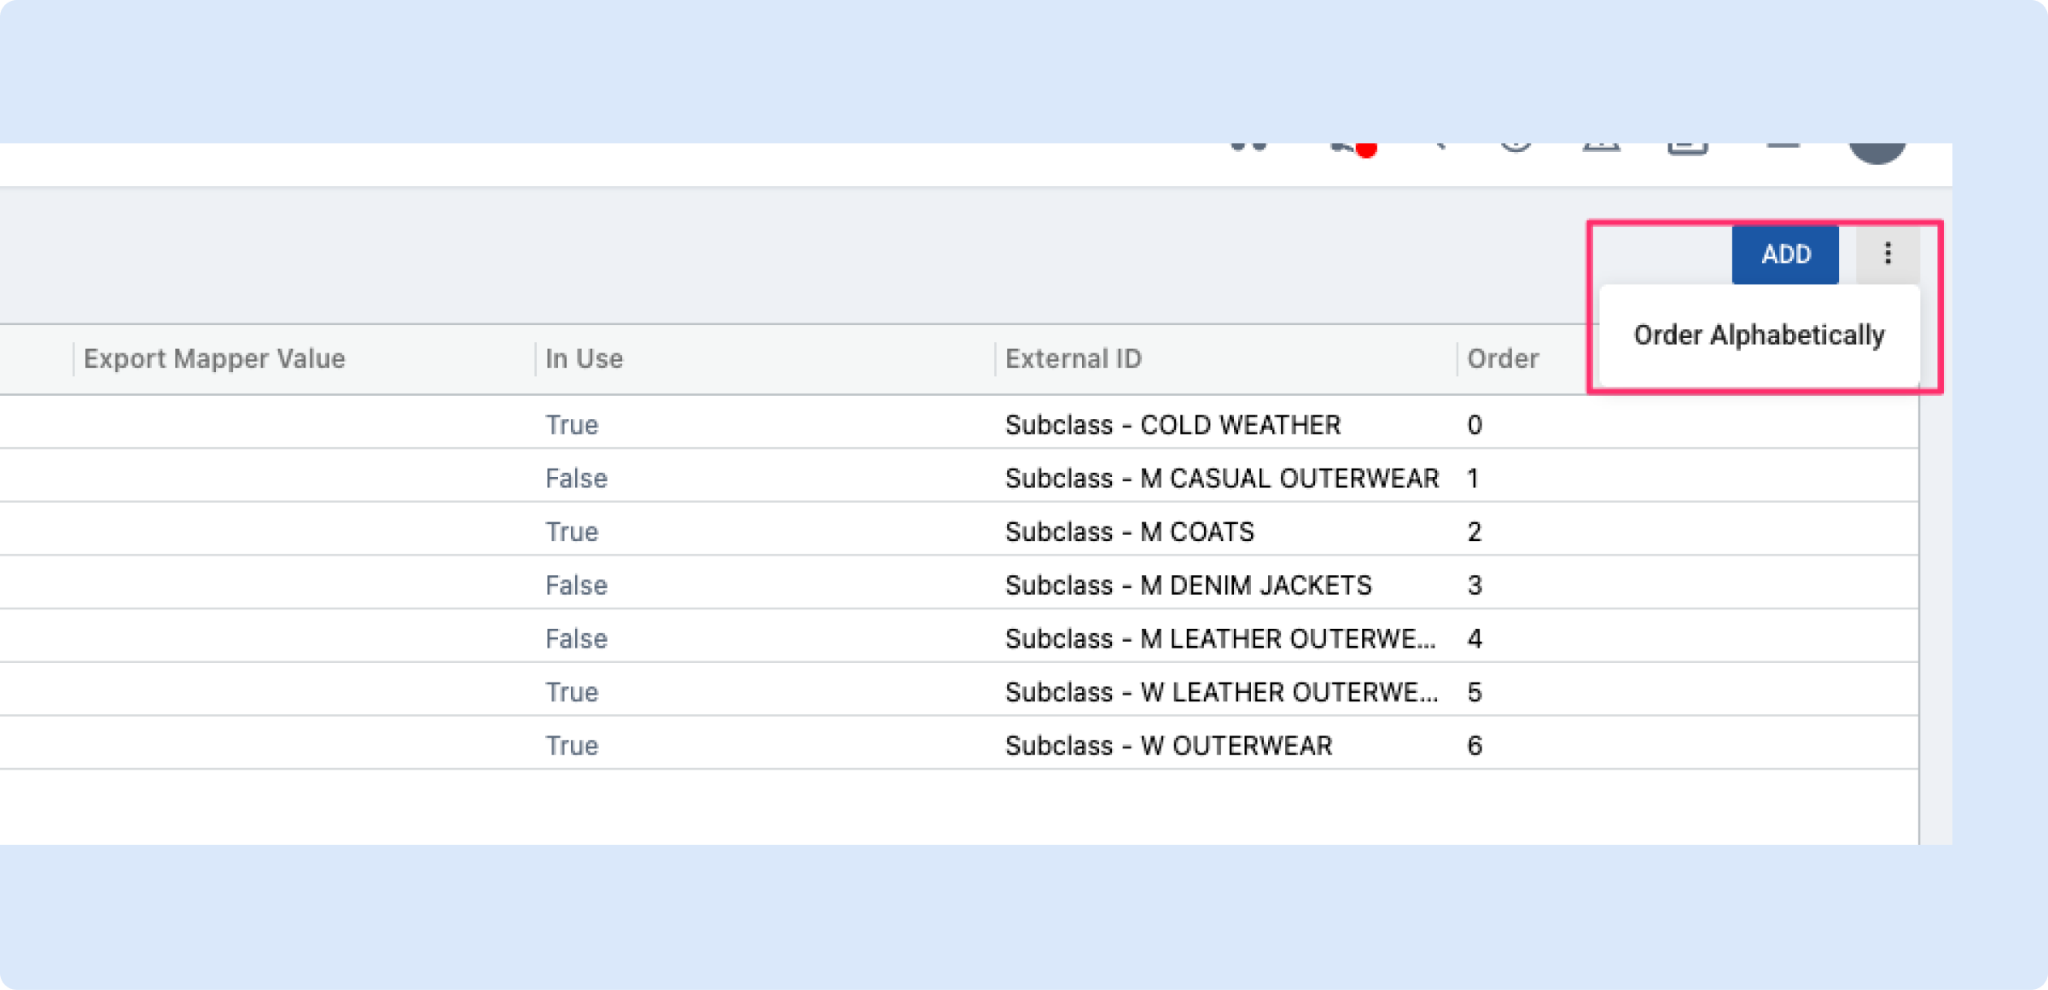
Alphabetical Ordering for Option Values
Added the ability to automatically order option values alphabetically.
- A new “Order Alphabetically” action is available from the Options page.
- This action reorganizes existing option values in A–Z order.
The feature is accessible from the Options page action menu (next to the Add button).
Impact
Makes it easier to quickly organize large lists of option values.
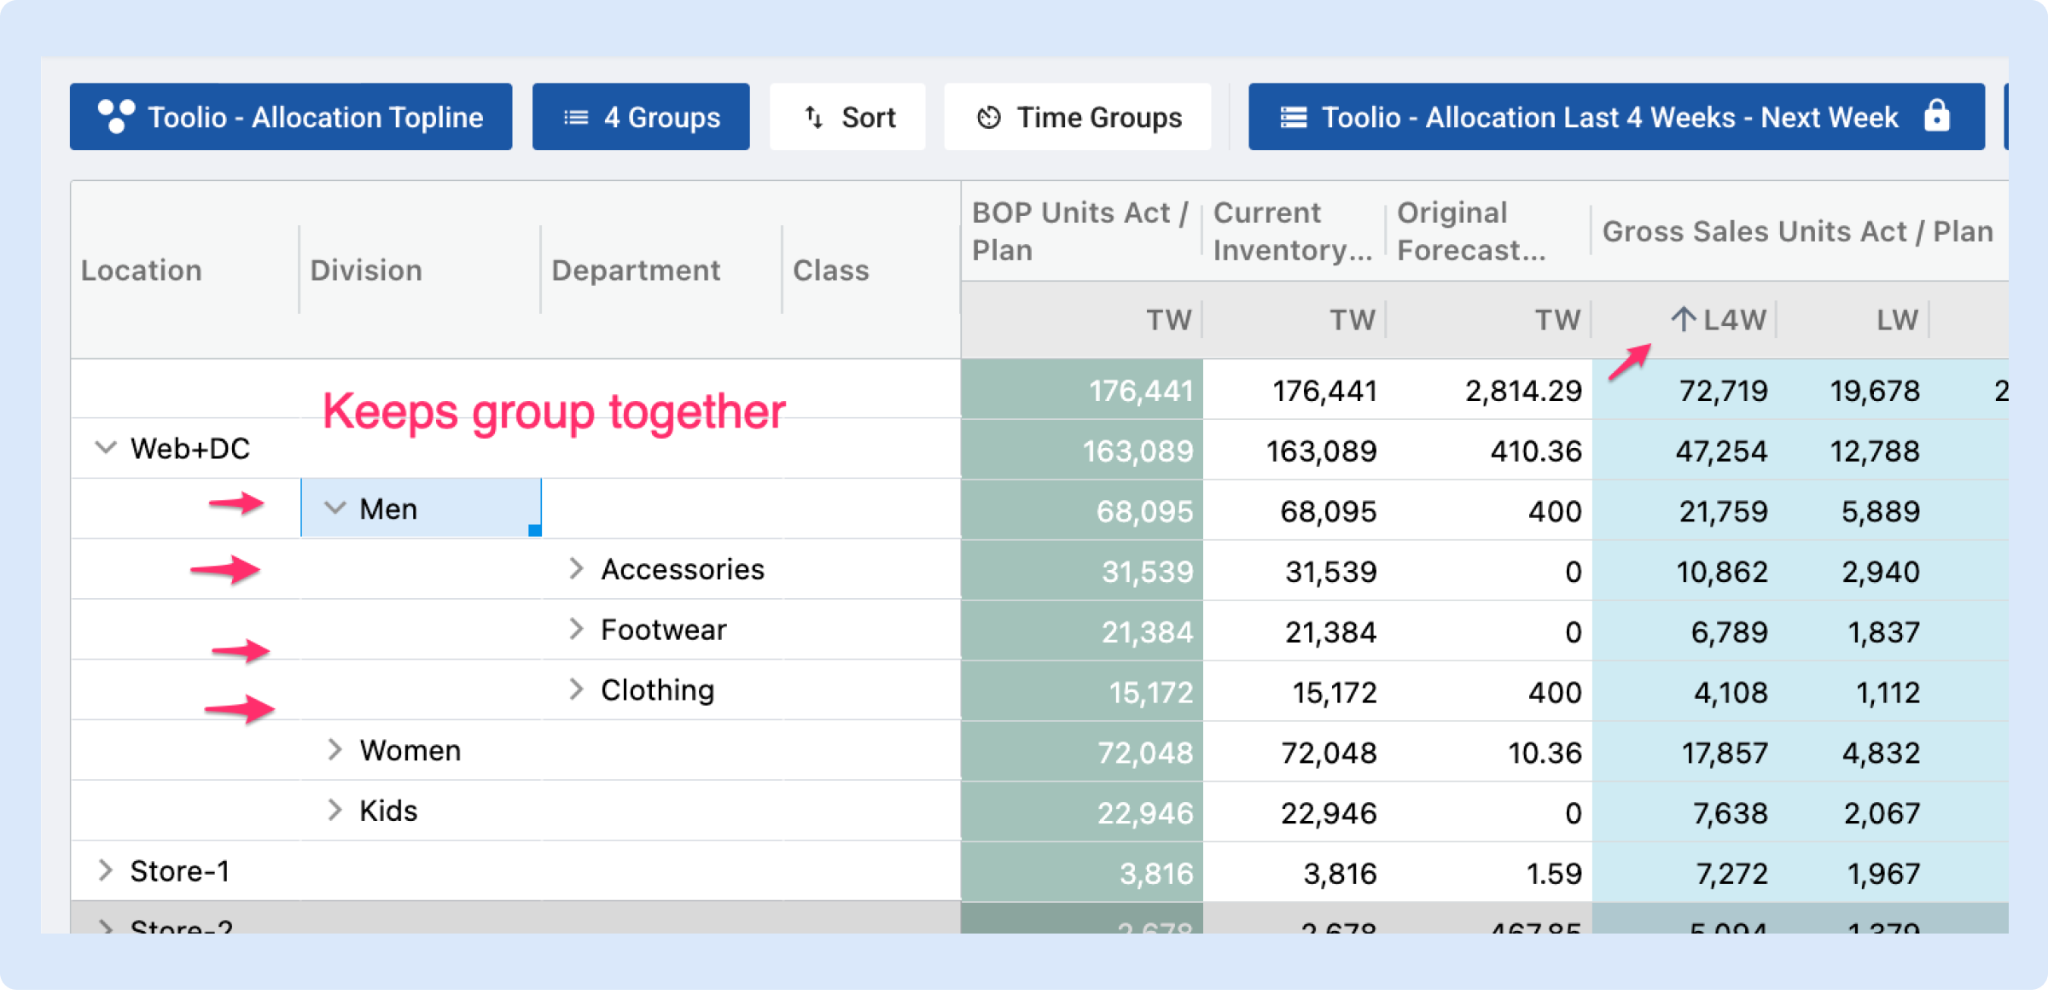
Product update — Sorting now preserves groups in hierarchical reports
We fixed a bug that could break the grouping in tables when customers sorted columns that use time or other hierarchical groupings.
Now when you sort those columns:
- Child rows stay with their parent groups (groups remain intact)
- Total rows stay pinned at the top so totals are always visible
- Sorting behaves predictably for multi-level reports, making analysis faster and less confusing
Who this helps: anyone using grids or reports with grouped columns (for example, assortment planning and allocation views).
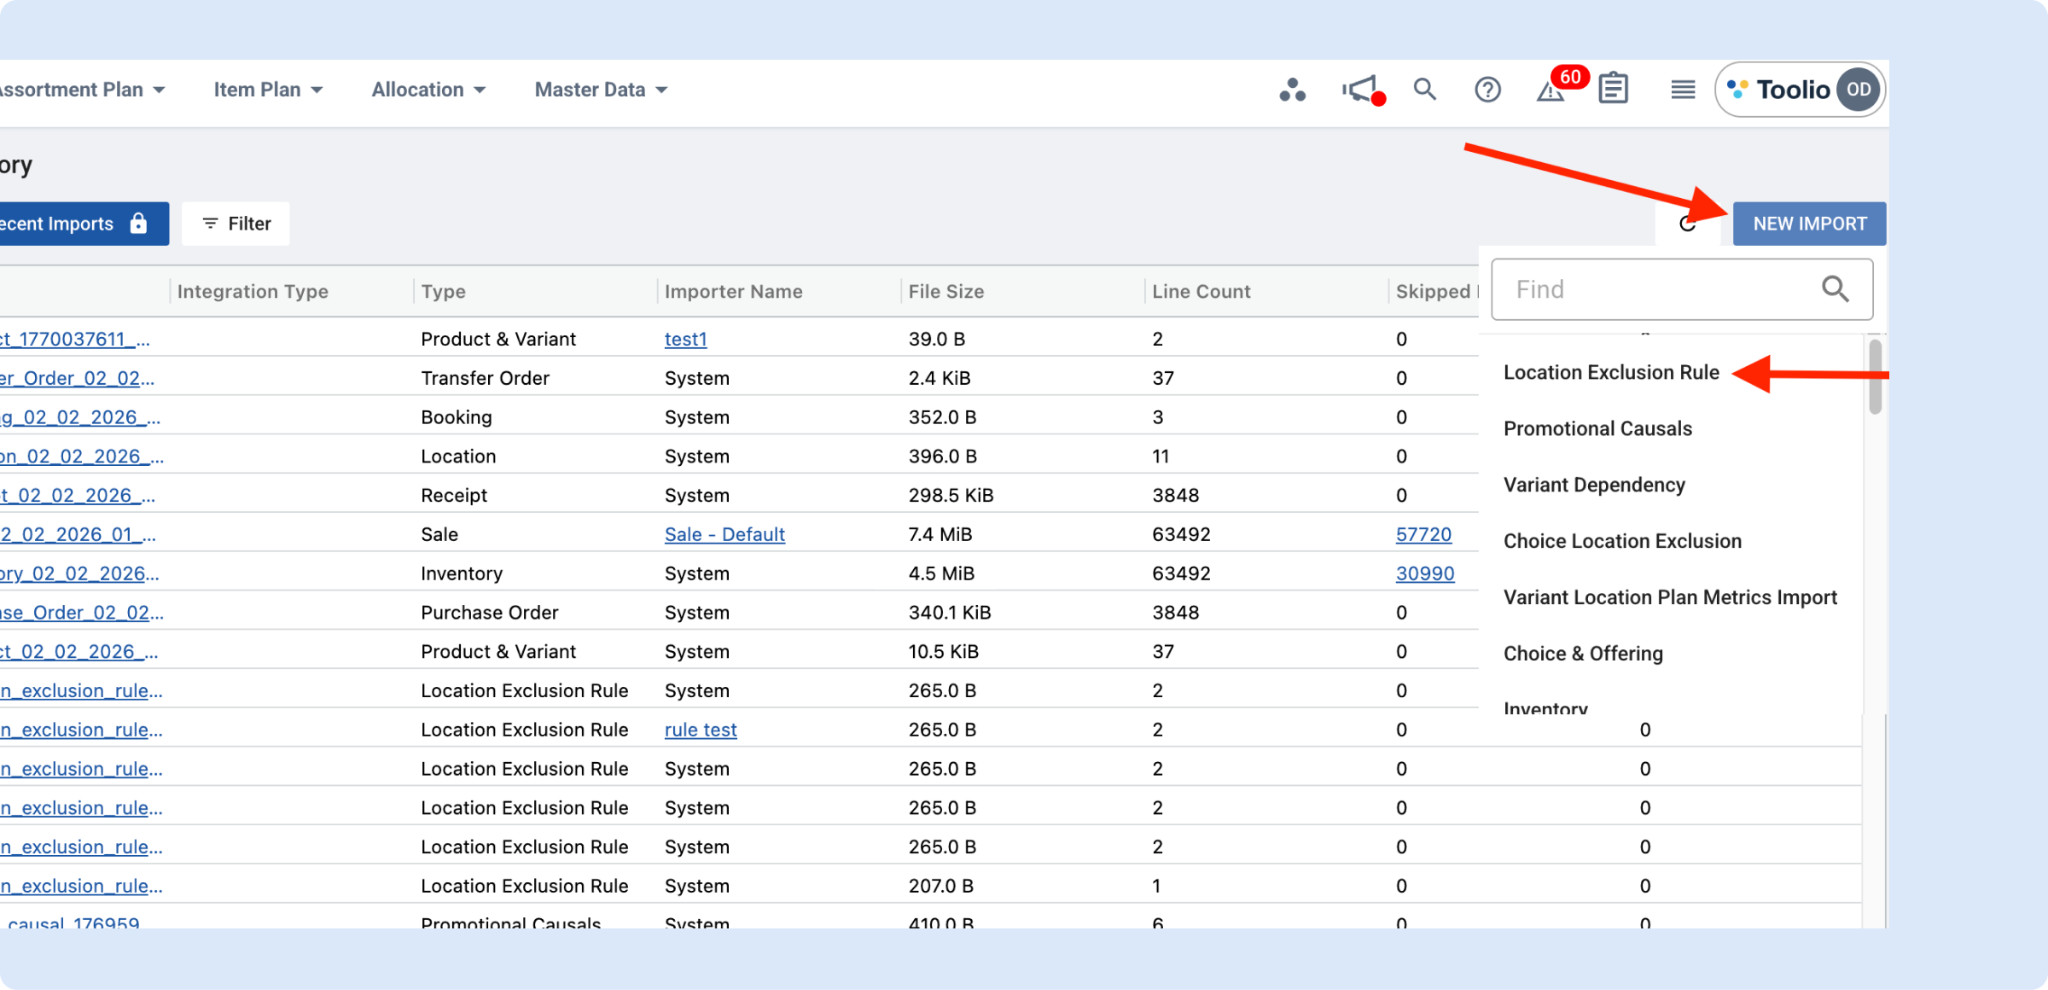
Importing Location Exclusion Rules (Bulk)
Toolio importers now support bulk importing Location Exclusion Rules using a dedicated import template, making it faster to roll out updates across many rules at once.
Template fields
- Rule Name (required): Must match an existing rule name for updates. If it matches, the rule will be updated.
- Filter Name: The exact choice filter name as shown in the Location Exclusion Rule Creation UI.
- Filter Operator: How the filter is applied (for example: has any of).
- Filter Value: The value(s) to apply (for example: Outerwear).
- Location Filter Name: The exact location filter name as shown in the Location Exclusion Rule Creation UI.
- Location Filter Operator: How the location filter is applied (for example: has any of).
- Location Filter Value: The location value(s) to apply (for example: Web, Store-3).
Notes to avoid import errors
- Names must match the UI exactly (including capitalization and spacing).
- Use semicolon-separated values when providing multiple values in a single field.
👉 Read more about Location Exclusions
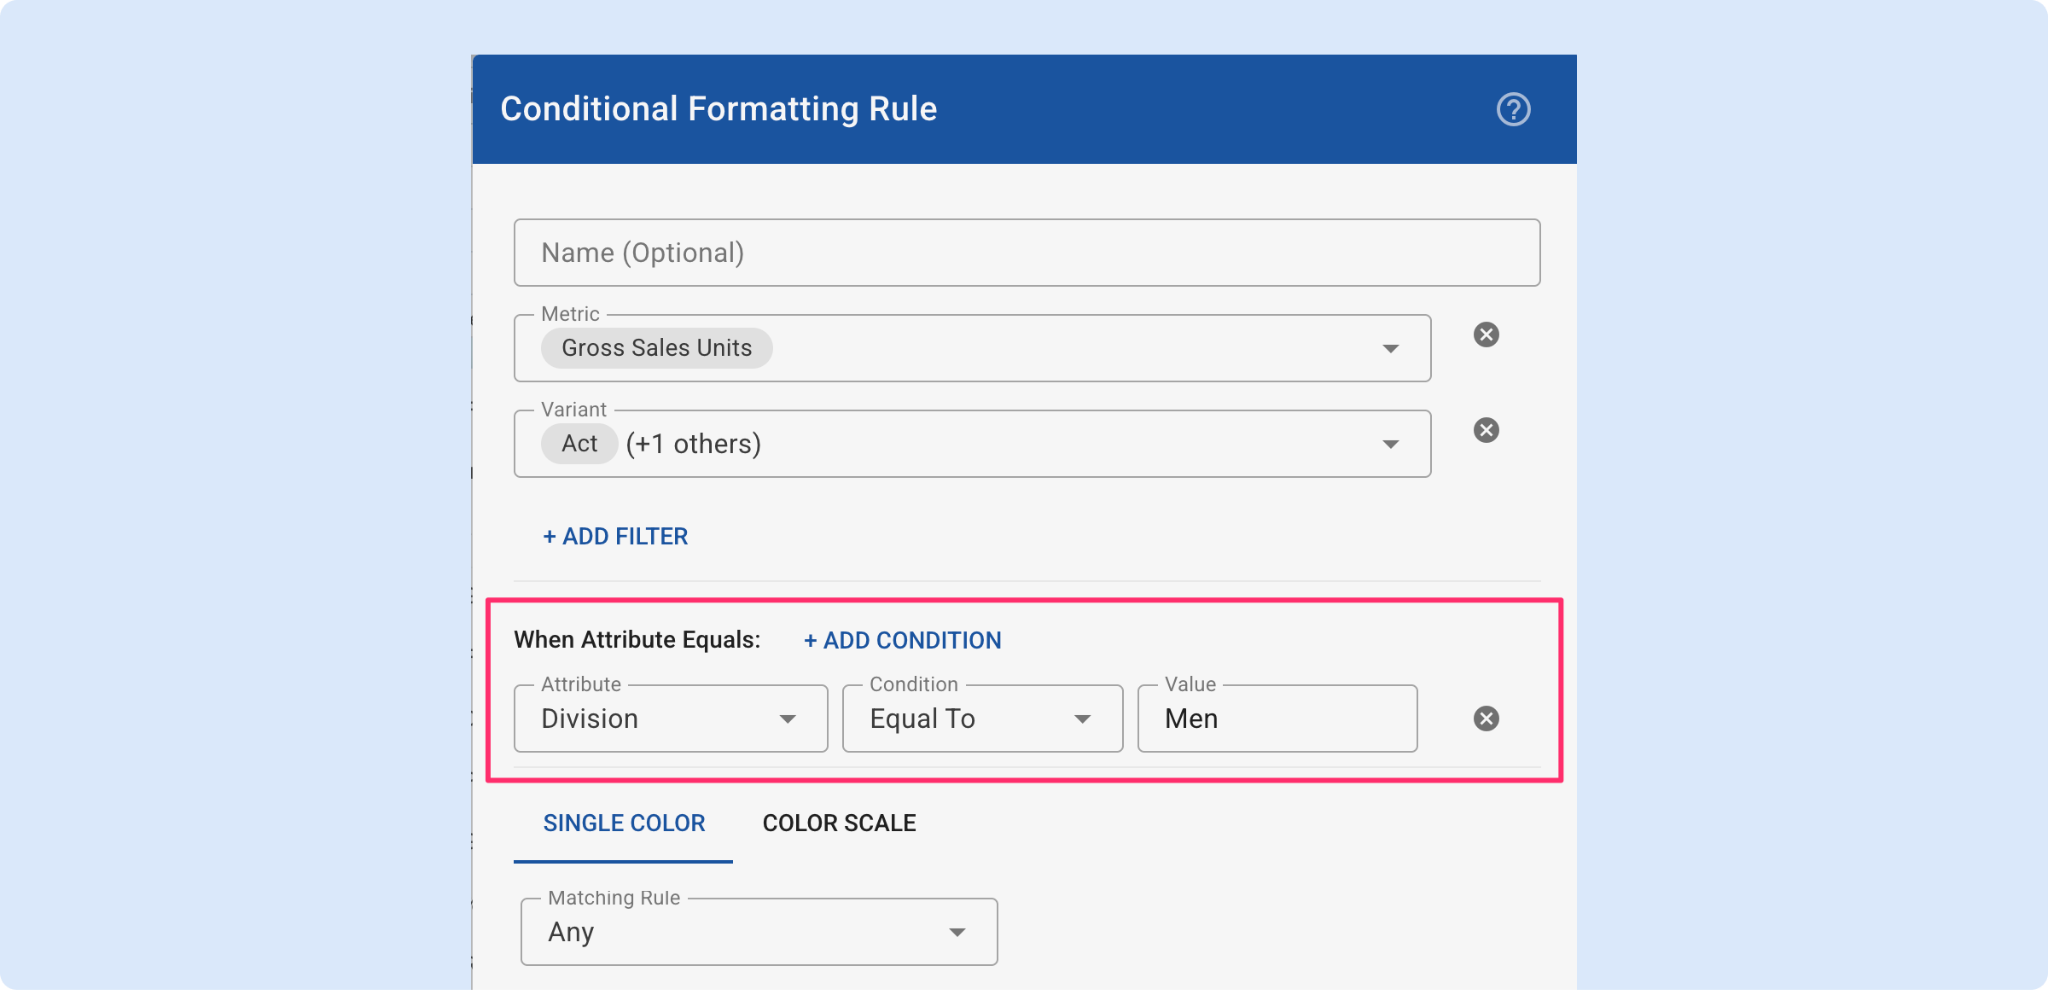
Conditional Formatting: Attribute-Value Conditions
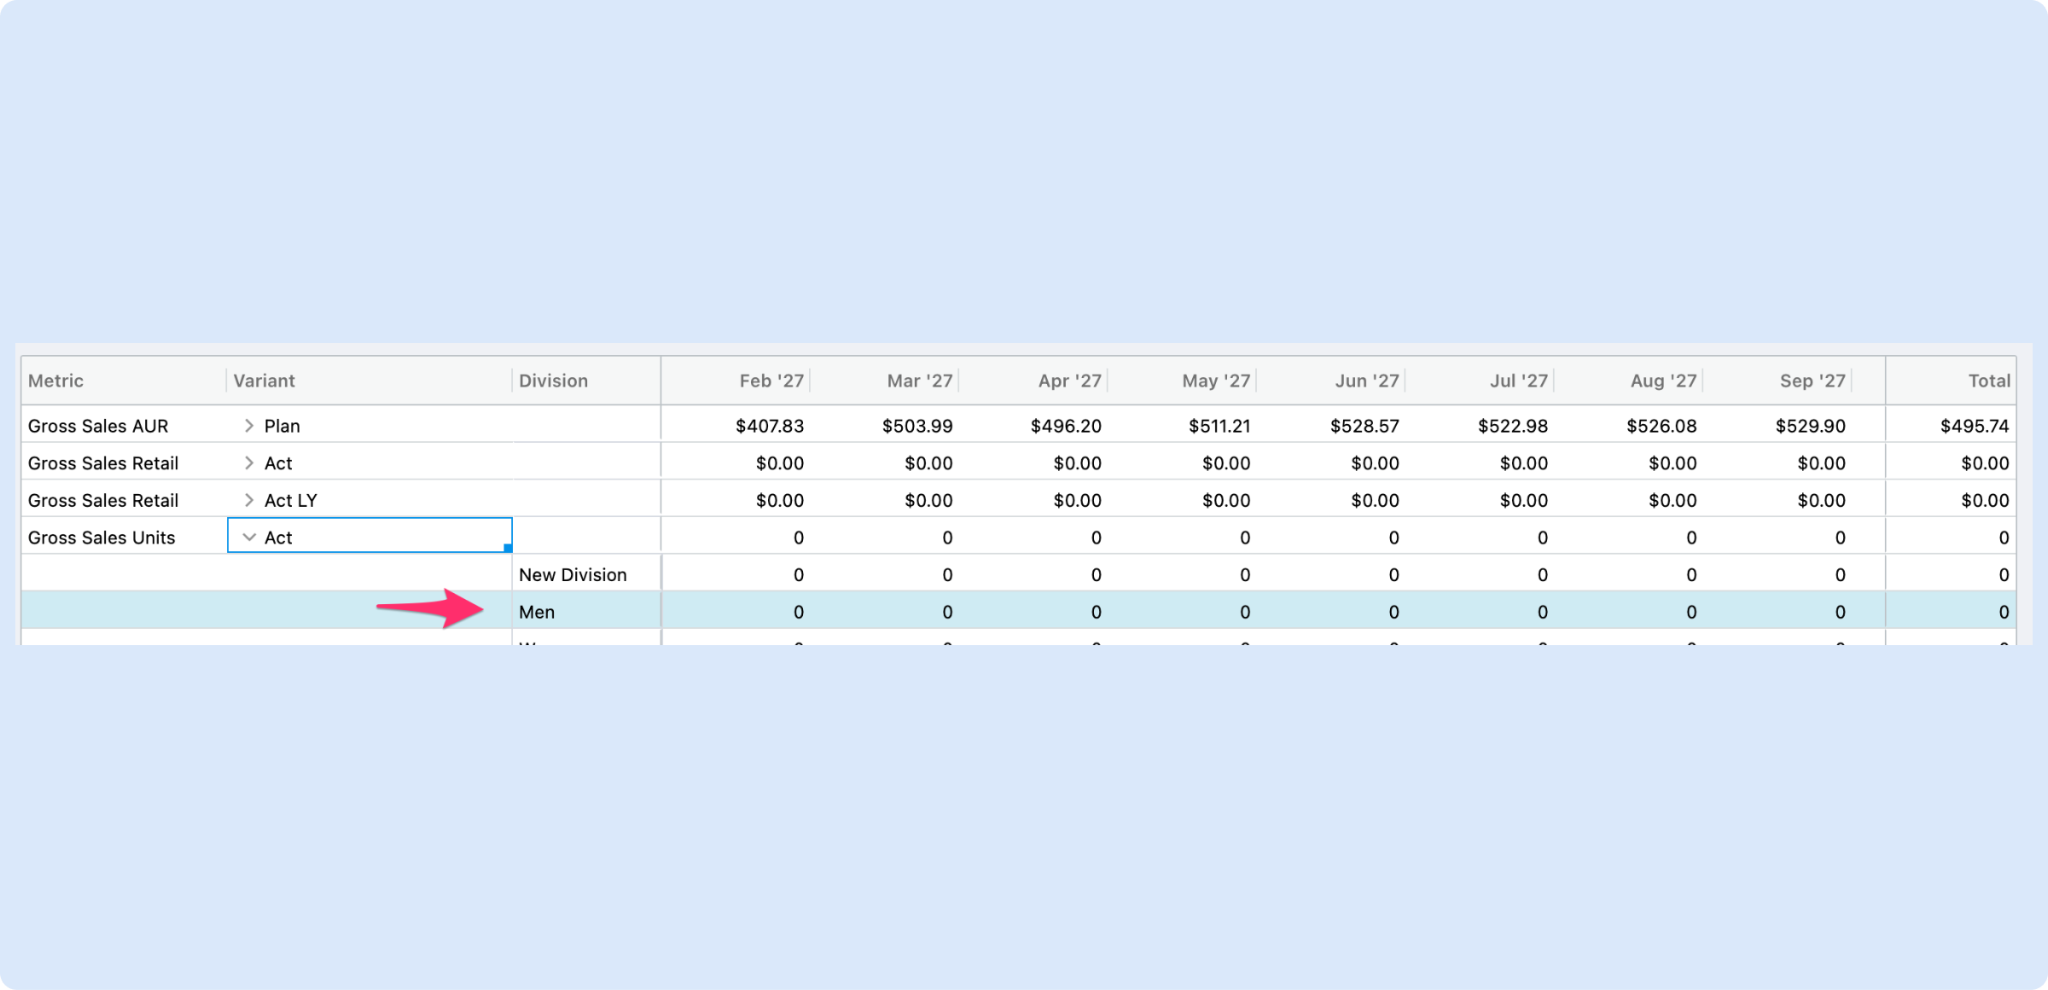
You can now scope conditional formatting rules to specific attribute values. Add one or more attribute-value conditions to a rule (AND logic) so formatting only applies when those attribute values match. For example
- Gross Sales Units when Channel = Web”
- Apply this rule when Product Type contains ‘Shoes’.
The Conditional Formatting UI shows a new When Attribute Equals section, which you can see below.
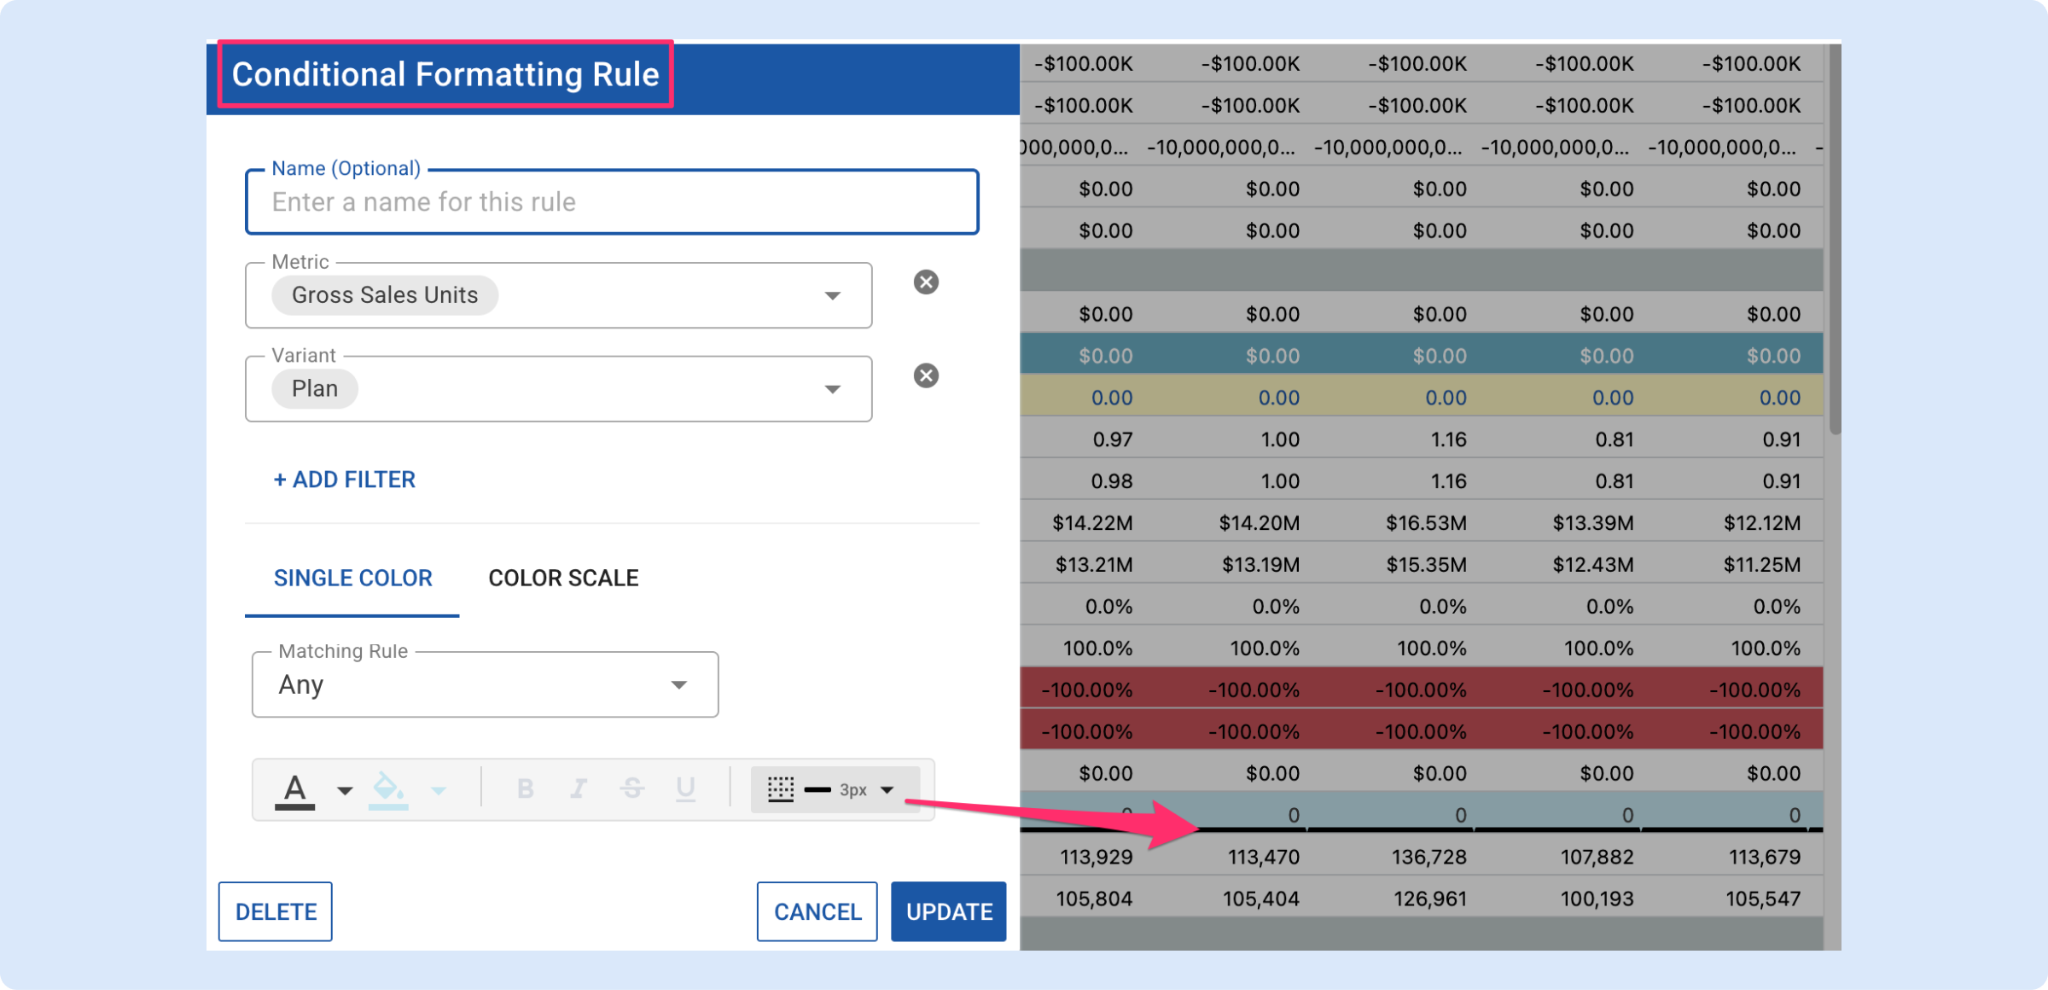
Border Controls for Conditional Formatting
We added border controls to the Conditional Formatting dialog so you can style grid cells with the same flexibility you expect from spreadsheets.
What’s new
A new Border control in the conditional formatting dialog that lets you choose:
- Border type: Left, Right, Top, Bottom, All Around, or Clear
- Color: pick any border color
- Weight: 1px, 2px, or 3px
The border button shows a live preview (selected border icon, a color bar, and the weight text) so you can see your choice before saving.
Why this matters
- Ability to separate metrics with clear borders — make key numbers and groups visually distinct for faster scanning and clearer reports.
- More customization on conditional formatting — get reports closer to the look and feel people are used to in spreadsheets, reducing friction when teams adopt Toolio for reporting.
Try it out in the Conditional Formatting dialog — choose the Border control, pick the type/color/weight, and preview the result before applying.
Shareable Deep Links
We’re introducing shareable deep links that capture the full state of a user’s view including selected dataset, filters, dynamic groups and scenario parameters directly in the URL. Instead of spending time recreating an unsaved setup, teams can now jump straight into the exact context someone is seeing with a single link. This is especially impactful for debugging workflows, where we anticipate time savings by eliminating back-and-forth and manual state reconstruction.
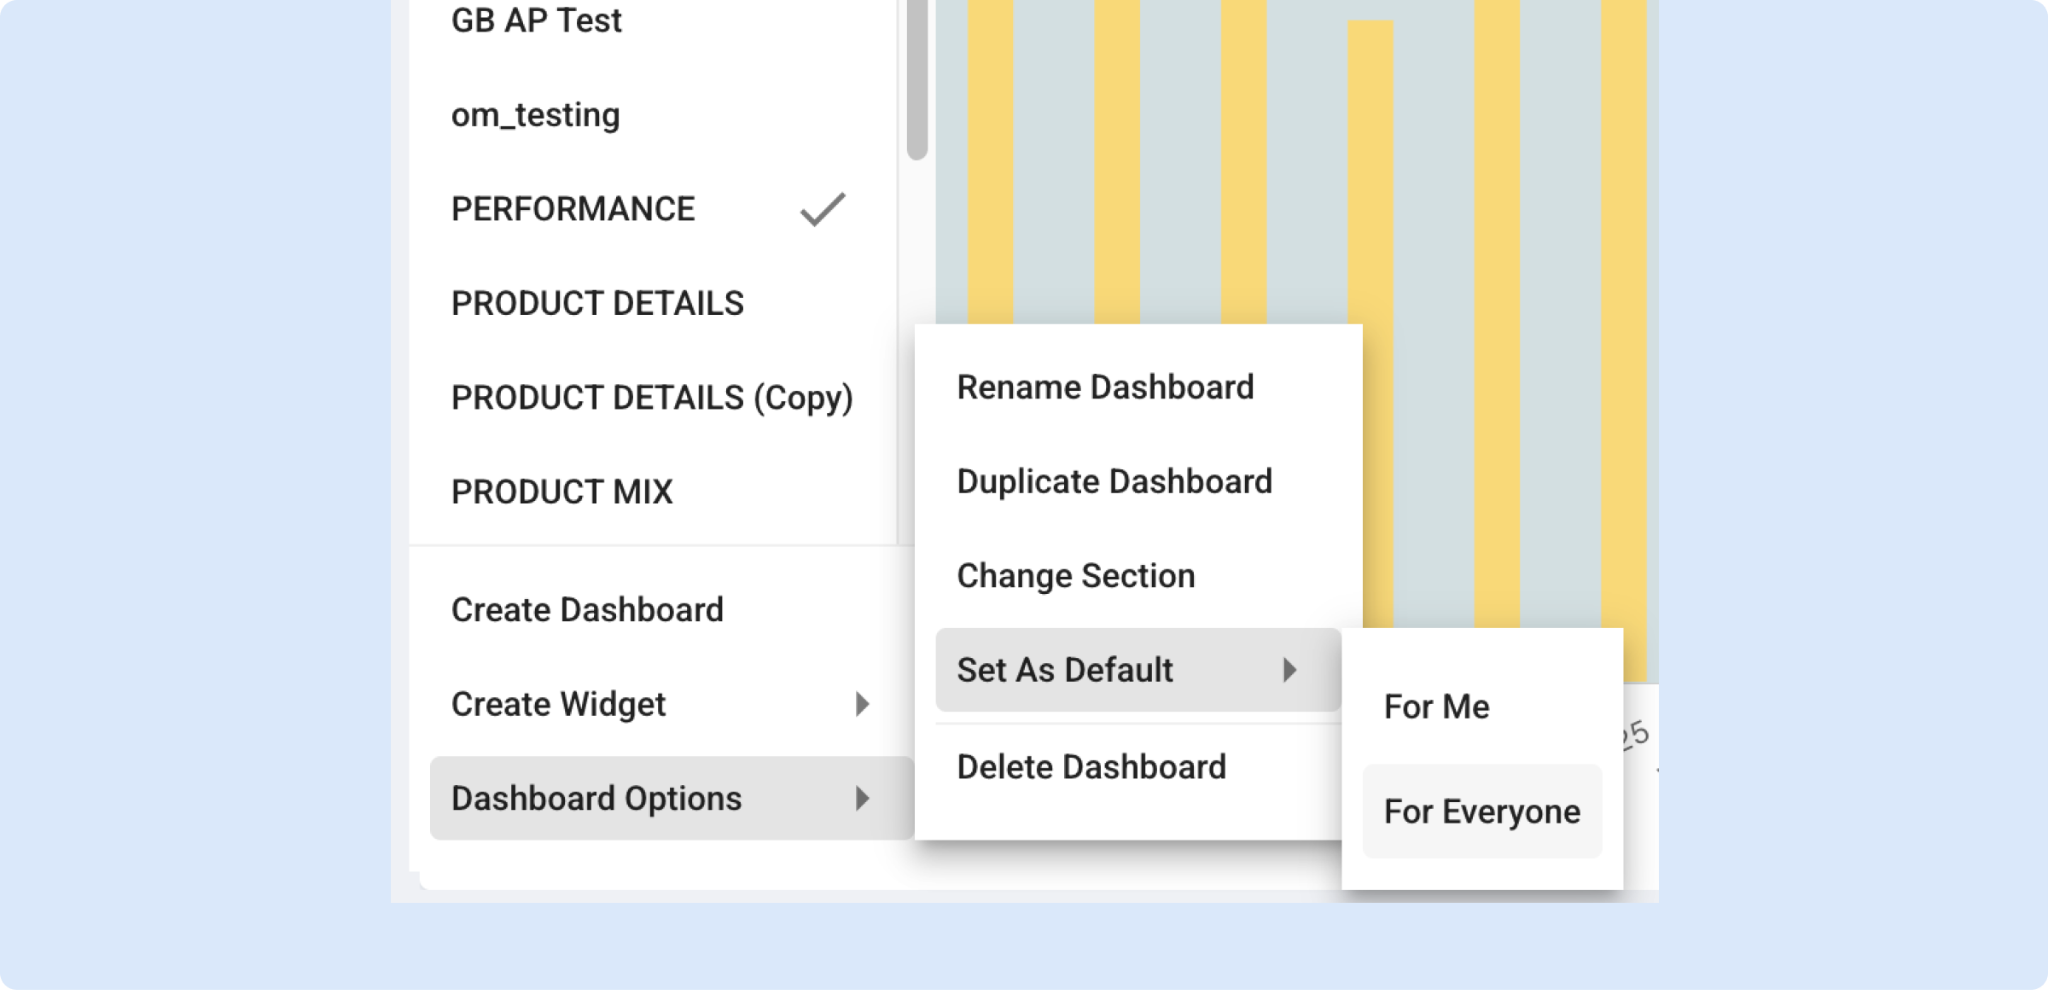
Set Default Dashboard
You can now set a Default Dashboard, making it easier to land on the right insights every time. Just like with Views, admins can assign a default dashboard for all users to ensure a consistent starting point, while non-admin users can choose their own personal default dashboard to match how they work. Fewer clicks, faster context, and a dashboard that feels like home from the moment you land on Dashboard module.
Need Help? We're Here for You!
Our support team is always ready to assist you. If you have any questions about these updates or need help getting started with new features, don’t hesitate to reach out!
Is there a feature you think would be a great addition? Let us know here!
