
homepage icon
Reporting & Analytics

Any report. Any view. Anywhere you want it.
‍Your Way.

Build any planning report, any way you want to see it. Toolio automates the pull, flags what needs attention, and delivers insights wherever you work, so your team spends less time building reports and more time acting on them.
Toolio AI Hero

Reporting, Built Around You

Toolio lets you create the exact reports you need to see your business clearly, run them automatically, and act on them wherever you work.

01

Create Reports in Minutes

Build reports yourself in a few clicks, or just ask Tooli, our AI assistant, for what you want to see. Already have a report your team relies on? Rebuild it in Toolio exactly the way it looks today and save it as a skill, so it’s ready to run whenever you need it.

Tooli Assistant Animation
02

Flexible Configuration

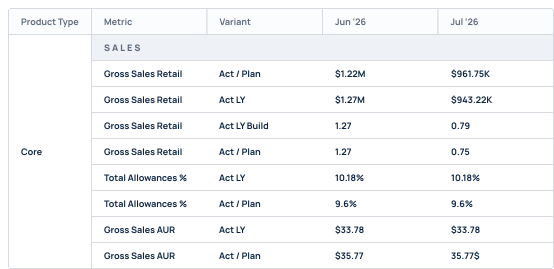
Switch layouts, drill from division down to class, slice by attributes like core vs. seasonal, and add conditional formatting so the numbers that need attention stand out. Change it once and keep it, or tweak it on the fly for a one-off question.

See performance by price tier
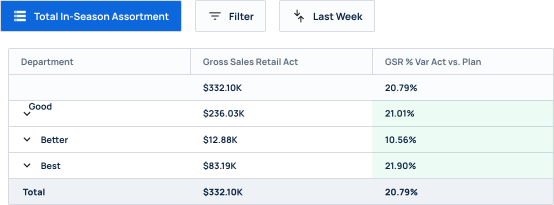
See Good, Better and Best side by side on sales, margin and sell-through. Spot which tier is working before the next buy, so you know where to add depth and strategize.
configuration box showing how to built custom ai agents
03

Automated Reporting

Toolio connects to your tech stack and refreshes your reports for you. Sales, plan and product images all live in one place. Your team walks into Monday ready to make decisions instead of building the report they need to make them.

Monday’s best sellers, automatically
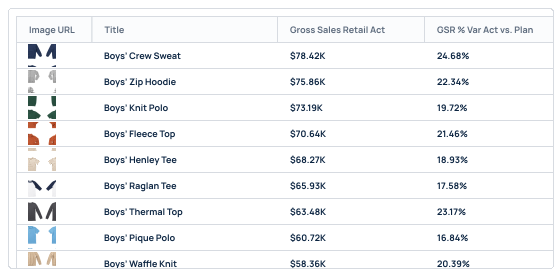
No more rebuilding this by hand every Monday. Last week’s top sellers come ranked against plan, L4W trend, last year and margin, so your merchants can act on winners and misses right away.
configuration box showing how to built custom ai agents

Match inventory to actuals

Too much stock where demand is soft, too little where it’s strong. See sales and stock side by side, four weeks back and four weeks ahead, and adjust or move inventory to where it’s selling before you have to mark it down.
configuration box showing how to built custom ai agents
04

Identify Issues and Exceptions

Set your own thresholds, like missed plan by more than 5% or more than 10 weeks of supply, and Toolio brings those items to the top. What’s beating plan, what’s turning too fast, what’s slowed down: it’s all waiting for you instead of buried in rows of data.

Catch lost sales before they happen

See potential lost sales next to planned receipts and what’s on order, by choice and by quarter. Spot the gap early enough to place or expedite an order before your best sellers sell out.
configuration box showing how to built custom ai agents

Spot store level gaps every week

See every product by store, color and size, against plan and current inventory. Catch the gaps each week and move stock to where it’s selling while it still sells at full price.
configuration box showing how to built custom ai agents
05

Execute Anywhere

Toolio shows you what needs to happen, whether that’s chasing more inventory, adjusting the plan or pulling back, you can act on it right away. Do it in Toolio, in Slack, or in the AI tools your team already uses, without exporting anything or switching between systems.

Toolio Plan Actions
06

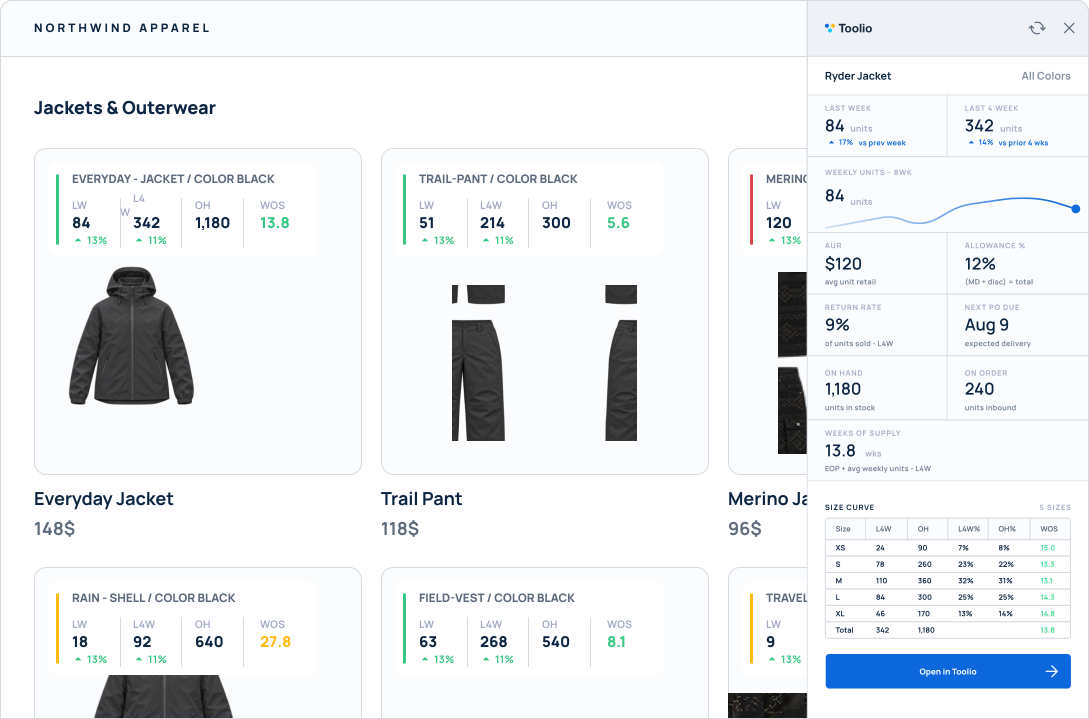
Your Planning Data, On Your Storefront

See sales and plan performance right on your site, product by product. Open the panel, pick the metrics you want, and see what’s lagging, and what’s running low. Your team can decide what to feature, push or mark down while looking at the product itself. No tab switching, no exports.

What Retailers Are Saying

Stacey Shriefer

Vice President Inventory Planning

“Toolio was instrumental in showing our merchants that they could have 50-75% less SKU count and do the same amount of sales. We expect $5M in cost savings and efficiency gains.”

Mike Carrozza

VP of Product Strategy

“One of the biggest changes [using Toolio] has been the ability to see cost impacts immediately. Before, we’d spend hours manually calculating margin shifts in meetings. Now, we can make those decisions instantly.”

Maggie Barclay

Planning Director

"There are so many metrics that have given us the data we need to feel more confident about buying deeper into merchandise. The weeks of supply metric has helped us see potential to reorder styles if they are selling at a fast rate or pivot with additional marketing tools if a style is moving at a slower rate."

Merchandise Plan dashboard screenshot

See Toolio in Action

The best way to understand what Toolio could do for your team is to start a conversation.

Frequently Asked Questions

We already have a BI tool. Why would we report in Toolio?

Keep your BI tool. It’s great for company-wide reporting. Toolio reports sit on top of your plan, so actuals show up next to plan, last year and on-order, and you can act on what you see without leaving the screen. Plan data can also flow back to your data warehouse or cloud storage, so your BI dashboards pick it up too.

My team lives in Excel. Do they have to give it up?

No. Export any view to Excel whenever you want. What goes away is rebuilding the same base report every Monday. Toolio refreshes it for you, so Excel becomes a place for analysis, not assembly.

Who builds and maintains these reports?

Your planners do. Build a report in a few clicks or ask Tooli for it. If you need a metric or attribute that doesn’t exist yet, create it yourself instead of filing a ticket with the data team.

How current is the data?

Reports refresh automatically whenever new data lands in Toolio, so Monday’s report is ready when your team logs in Monday morning.

Can shoppers see Toolio Overlay numbers?

No. The Overlay only runs in the browser of a signed-in Toolio user. It doesn’t change your site, can’t read carts, checkout or anything a shopper types, and each person sees only the data their Toolio account already has access to.