









Assortment Planning
Set Receipts on Any Week
You can now set receipts on any week in a choice's offering window — including weeks that never had receipts planned — from both the Receipts Plan tab and the Metrics tab, editing inline without opening the Receipts Plan dialog first. Moving a receipt to a new week automatically clears it from the old one, and any receipt you set by hand is marked as an override with a yellow caret. It makes manual receipt adjustments faster and easier to track.
Dynamic Grouping now available in Location Assortment
Location Assortment can now be grouped and filtered by Dynamic Groups, bringing the grouping experience already in Merchandise Financial Planning and AP Reporting to this screen. You can group grid and gallery views by any dynamic group — including location-based groups like Area Type or Region — and create or edit those location groups directly from Location Assortment. Use the new Dynamic Grouping selector to get started.
Receipt Calculations Now Look Ahead Across Lines
When you plan back-to-back strategies for the same choice, receipt generation now looks ahead to the next line's sales plan so safety stock holds steady through the handoff instead of tapering off before the next choice picks up. Your Safety Stock, Order Cycle, and Lead Time settings carry through the transition, and on-order still flows as before.
Show Raw Data on the Assortment Plan Metrics Grid
You can now right-click any number on the Assortment Plan Metrics grid and choose Show Raw Data to jump to the imported rows behind it — the same action already in Merchandise Plan and Item Plan. The Master Data page opens pre-filtered to the choice, the stores your plan actually includes, and the period of the column you clicked, and it respects your grouping context. It lets you validate a planned or actualized figure in seconds instead of rebuilding filters by hand.
👉 Read more in Metrics Management - Plan Review
🔒 Lock Receipts Through
You can now lock a choice's receipts through a date you choose, holding every receipt on or before it in place so Generate Receipts leaves those weeks untouched while re-planning later dates. Setting, changing, or clearing the date re-runs Generate Receipts automatically, locked weeks are clearly marked on the Metrics and Receipts Plan tabs, and you can still override one by hand. Lock the weeks you've already committed and let the system re-plan the rest.
👉 Read more in How to Lock Receipts Through a Date
🪟 Ask Tooli for Views on Assortment Plan Reporting
Tooli's view building now covers Assortment Plan Reporting, on top of Merchandise Plan and Allocation Plan: describe the choice-level report you want and get it saved as a Reporting view, grouped by the full attribute set the screen offers, including choice, style, location, and season attributes. You can refine it in the same conversation — add a metric, change the grouping, adjust filters, show or hide columns — without disturbing your column widths or pinned columns.
👉 You can already ask Tooli to build and manage your saved views on Merchandise Plan and Allocation Plan. That now covers Assortment Plan Reporting too.
🎛️ ROS Product Preview: Pick Your Own Metrics and Attributes
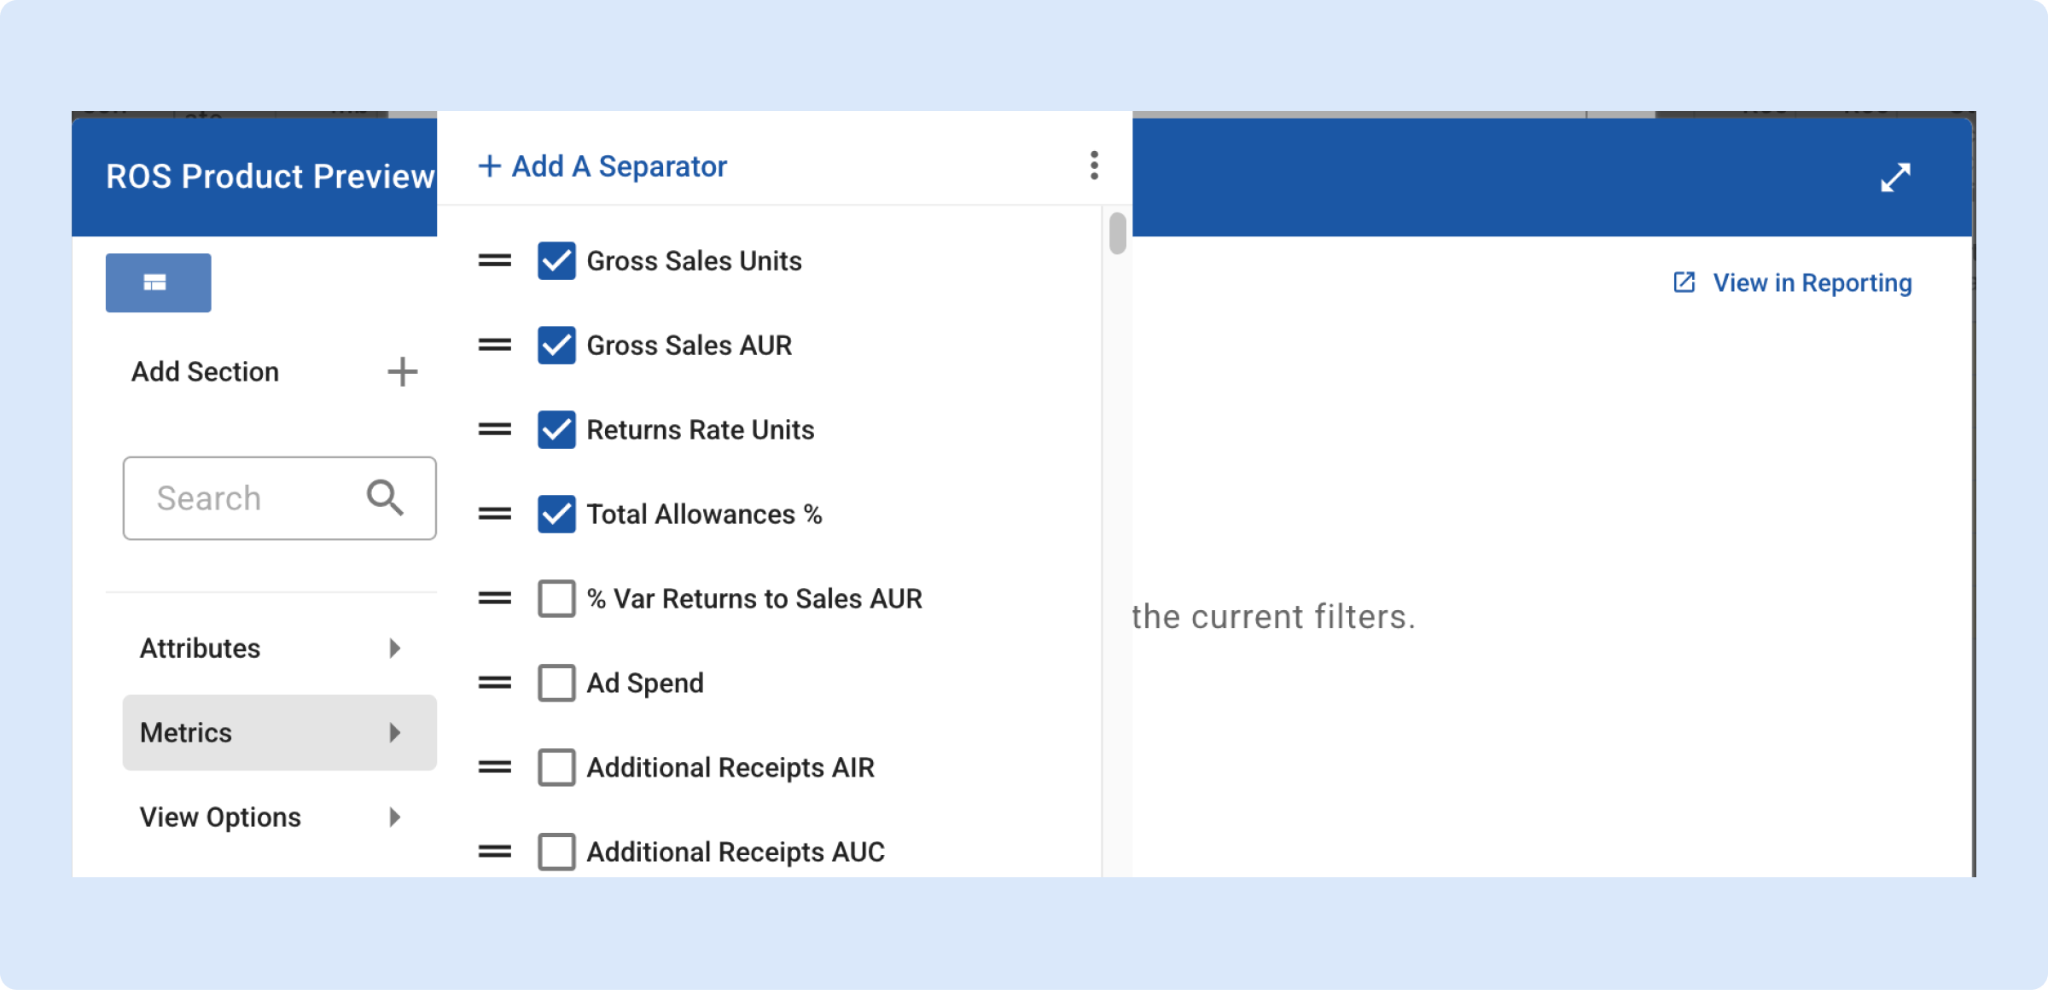
The product preview inside the ROS Model no longer shows a fixed set of fields — you now choose which metrics and product attributes appear on the cards, set their order, and save the setup as a named view that returns next time. Create, rename, and delete views and set a default so every preview opens the way you want, with real attribute values like Color shown on the cards. It replaces the four always-on fields with exactly the fields that identify what you're looking at.
🔍 Show Calculations for Sell Through %
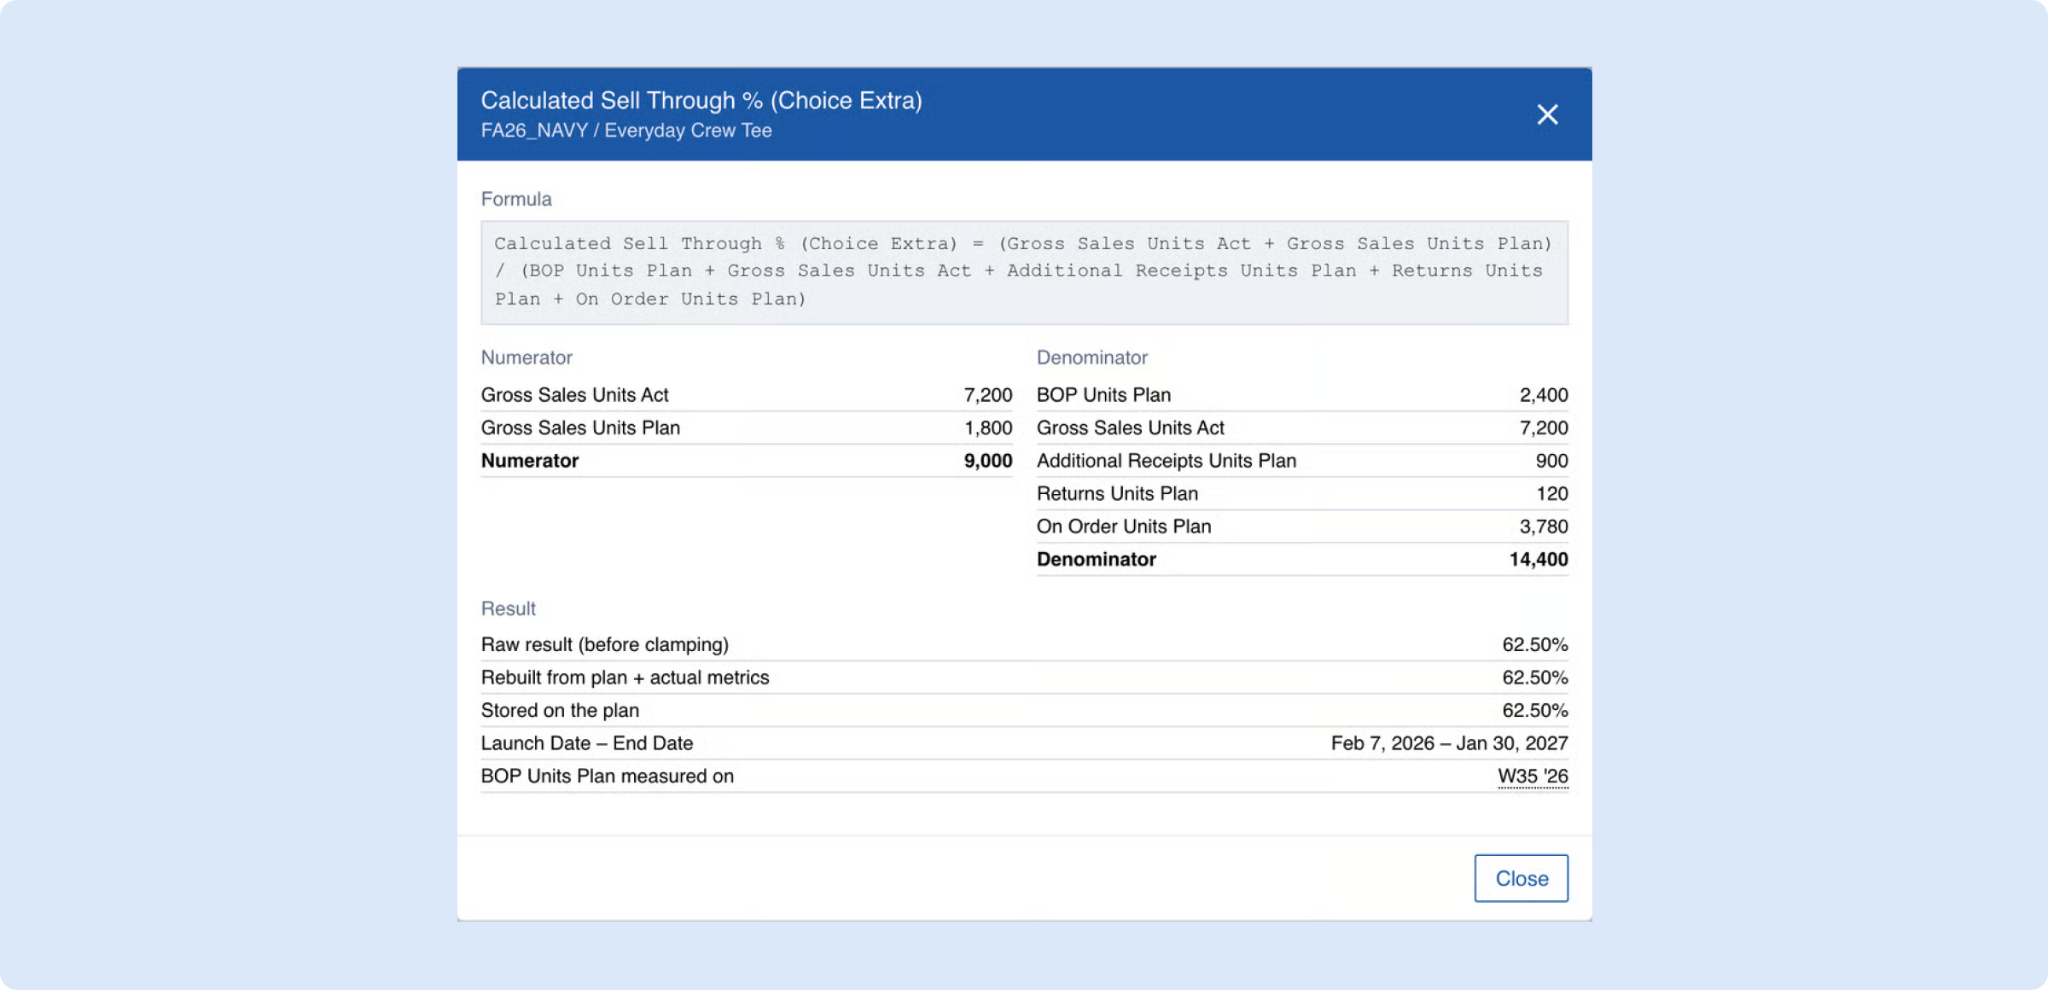
Show Calculations now covers Calculated Sell Through % and Phase Out Sell Through % in the new Assortment Plan: right-click either metric on a choice or offering row to see the formula, every input that fed it, and how the result was reached. The dialog splits the calculation into its numerator (actualized and planned sales) and denominator (BOP Units, actualized sales, Additional Receipts, Returns, and On Order Units), each with its own figure. It makes a surprising percentage easy to trace.
👉 Full details in Receipts Generation and Reviewing Receipts Plan
📦 Pack Ordering
Toolio can now turn a Recommended Purchase Order's size-level demand into prepacks — predefined bundles of units across sizes — plus a singles remainder for whatever the packs can't cover cleanly. Build a catalog of generic size-ratio packs or SKU-bound case packs under Settings → Configuration → Intelligence → Packs, assign packs to each choice, and let Toolio work out how many of each to buy. It brings pack-based buying into the purchase order flow.
👉 Learn more about pack ordering
✏️ Edit Assortment Plan with Tooli
Tooli can now change your Assortment Plan from a plain-language request, applying edits to the choices you name. Set launch and end dates, unit cost, retail, ticket, markdown weeks, growth rate, or adjusted ROS across a whole set of choices at once, target a single cluster or channel so staggered launches stay intact, or add placeholder styles to an assortment. It turns bulk assortment edits into a single ask.
🗂️ Expand All is now saved with your view in Assortment Plan
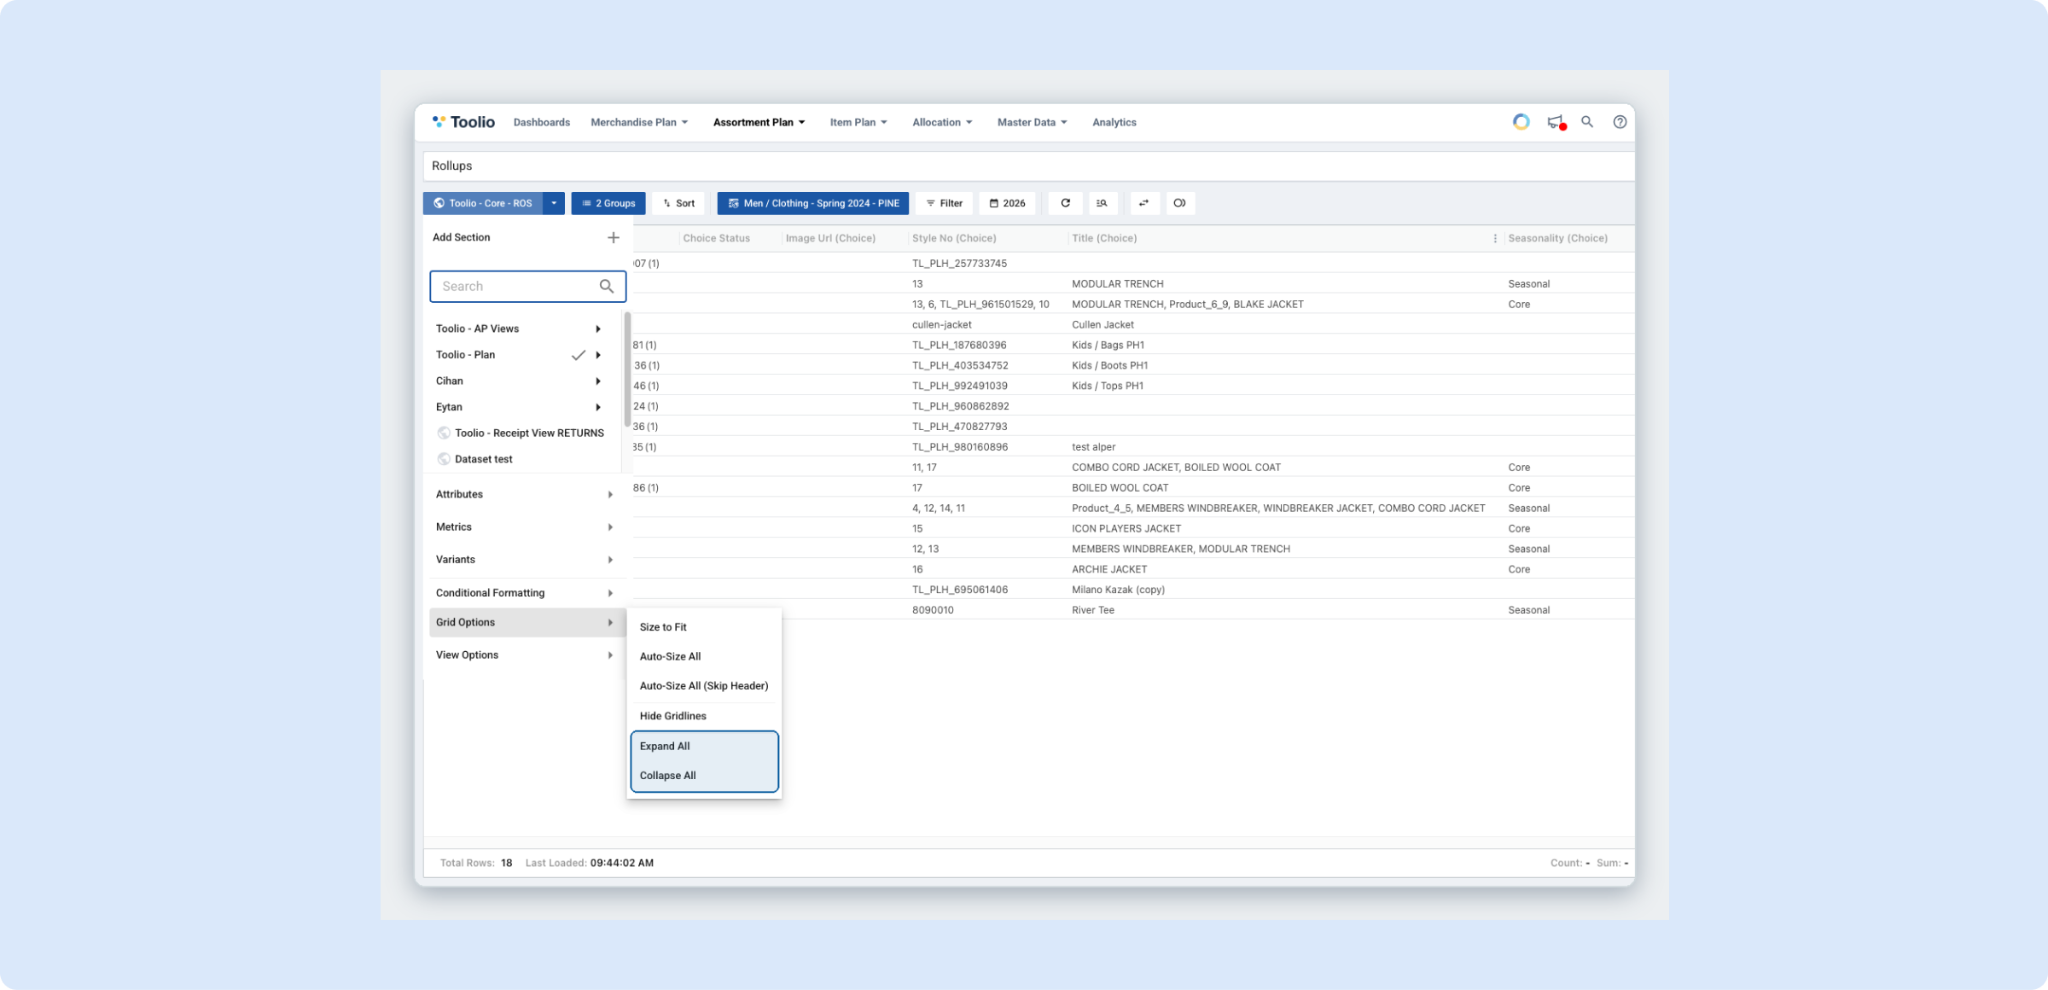
Expanding or collapsing your grouped rows on the Assortment Plan is now part of the saved view, so a grid set to Expand All reopens fully expanded and one set to Collapse All reopens as a summary. Both actions are available from Grid Options in the view menu. It means a view keeps the level of detail you intended every time you open it.
Edit Assortments Directly from the Assortment Summary
You can now edit an existing assortment’s name, filters, product hierarchy, and time frame by right-clicking it on the New Assortment Plan screen, instead of rebuilding it from scratch. Toolio recalculates its metrics in the background when you change the scope, and a new Created By attribute shows who built each assortment so you can filter or group a busy list by owner.
👉 Read more in Creating a New Assortment
📈 Edit Curves and Allocation Defaults with Tooli
Tooli can now write changes back to your Intelligence settings instead of only reading them — rename or retime a curve, fix a size spread or the weekly weights on a sales or launch curve, or regenerate a size, sales, or location curve from current data, all from the conversation. Nothing is applied until you approve it, and the same works from any AI assistant connected through the Toolio MCP Server. It collapses multi-step settings edits into a single natural-language request.
👉 Available for organizations with Tooli or the Toolio MCP Server and Intelligence settings enabled, for users with write access. Connecting to Toolio MCP Server
Metrics tab views can now follow the page timeframe
Saved views on the Assortment Plan Metrics tab used to be permanently pinned to the date range they were saved with; now you can check Use Page Timeframe in the tab’s three-dots menu so the view re-syncs to the page timeframe instead. You can still pin a specific range when you want one. This keeps older views from snapping back to stale dates and leaves you one timeframe to manage.
👉 Read more in Metrics Management - Plan Review
🏭 System Recommended Warehouse Splits
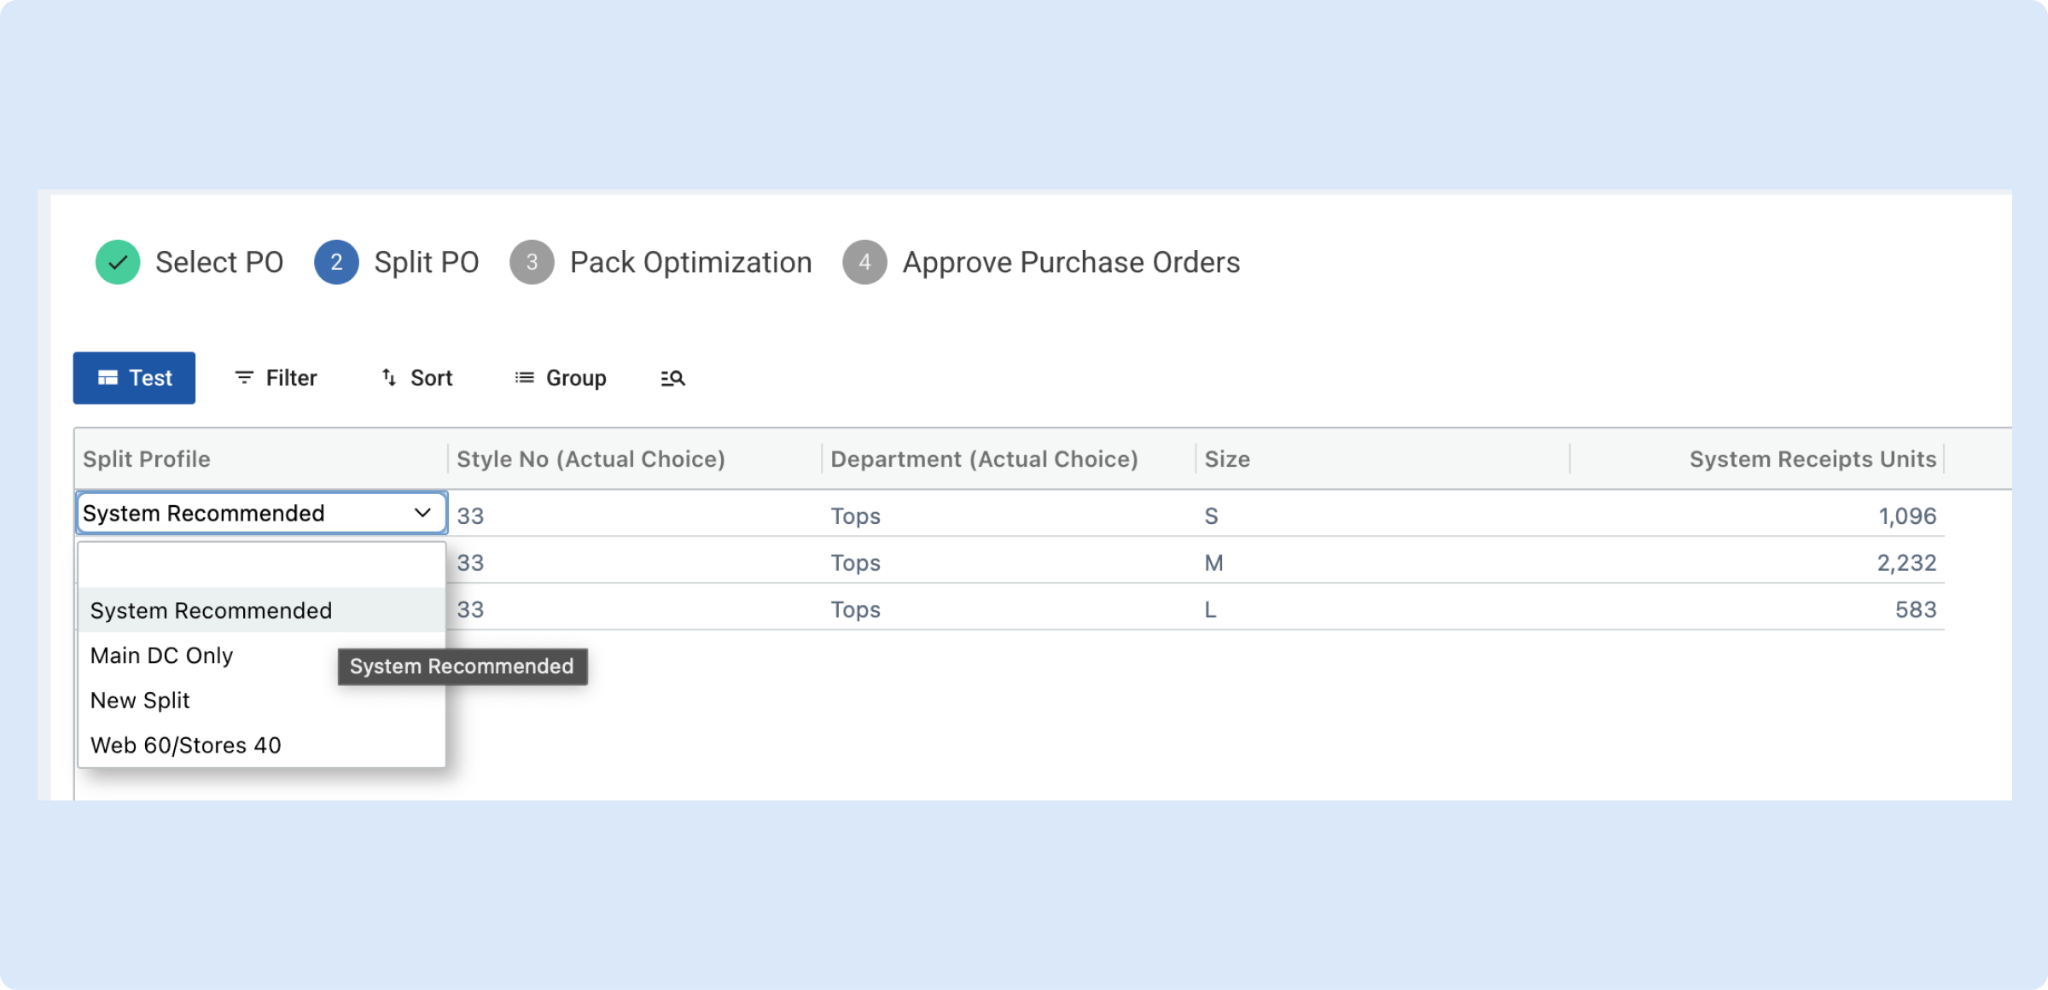
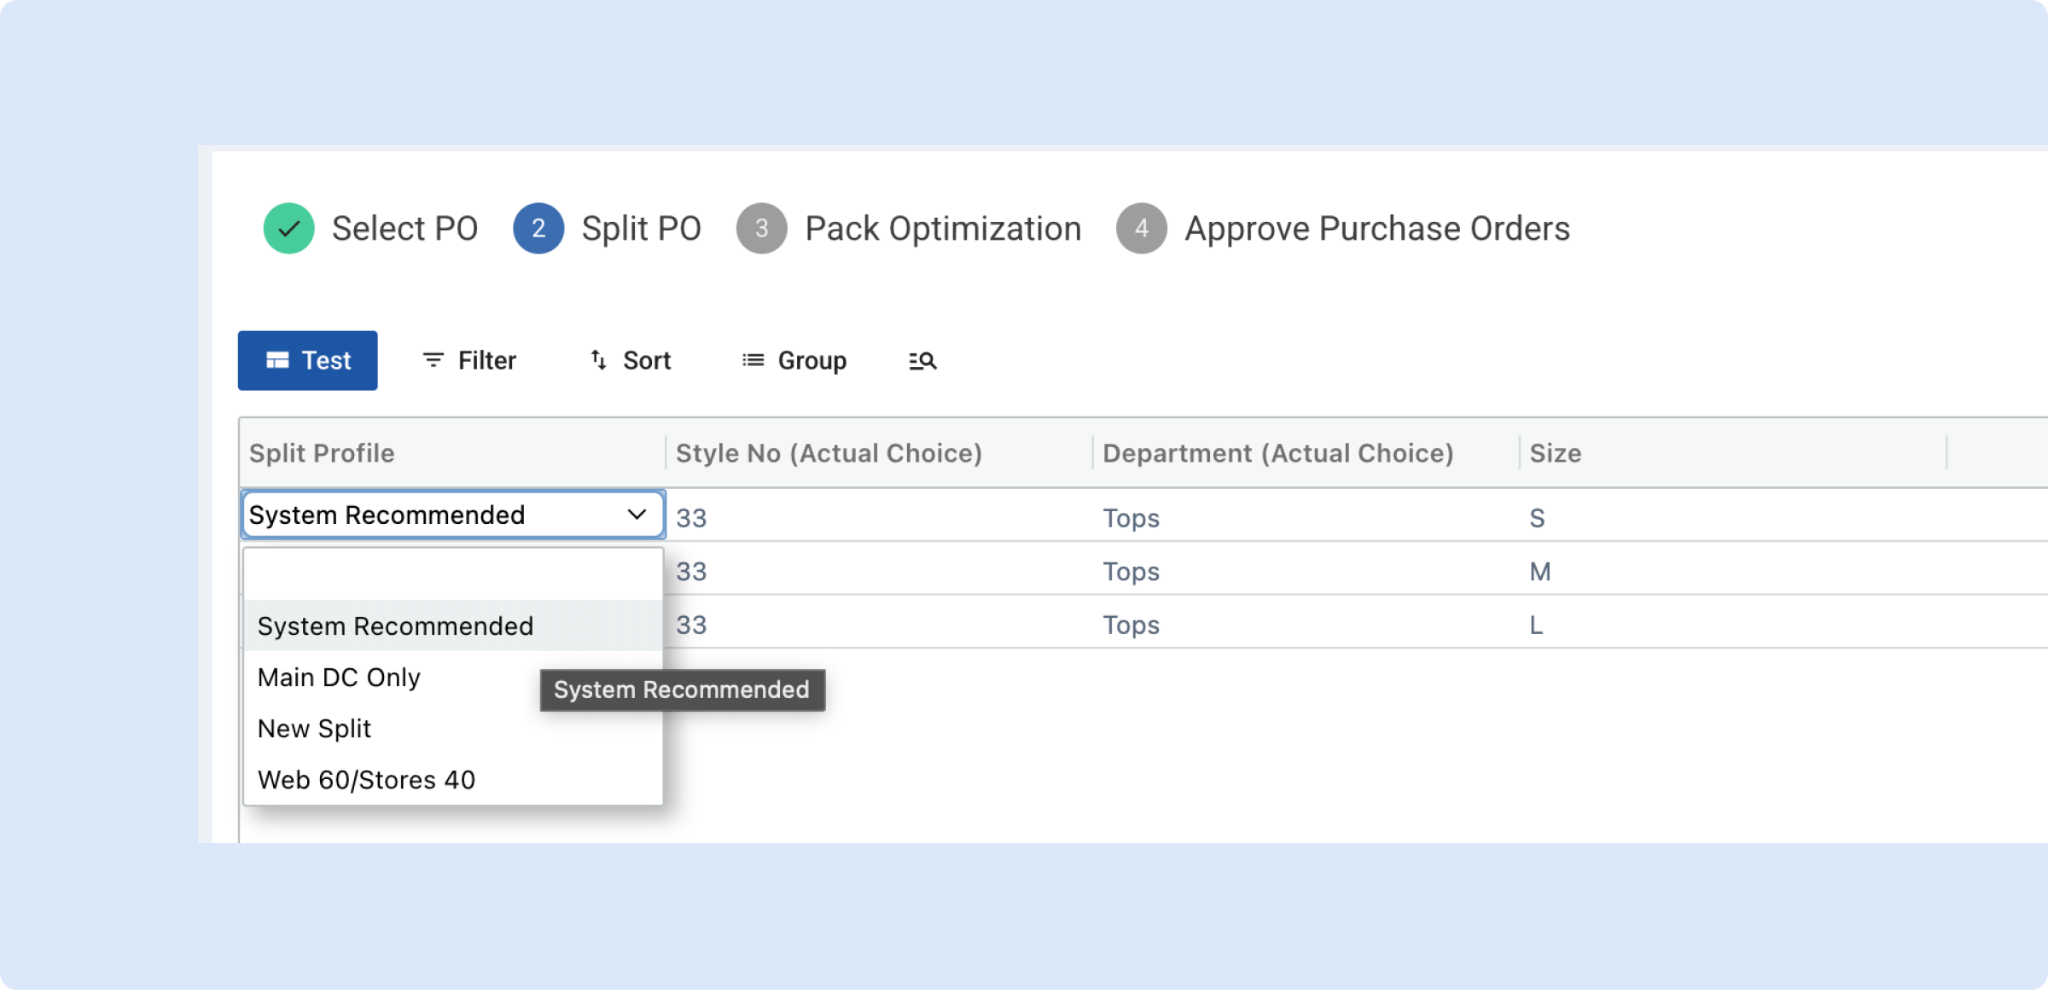
A new System Recommended split profile lets Toolio divide a Recommended Purchase Order across warehouses by demand rather than fixed percentages. It attributes each store’s planned demand to the warehouse that fulfills it, then nets out each warehouse’s projected stock on hand and on order before splitting. The result is an order split that reflects what each warehouse’s stores are actually planned to sell.
🪟 Ask Tooli for Views on Assortment Plan
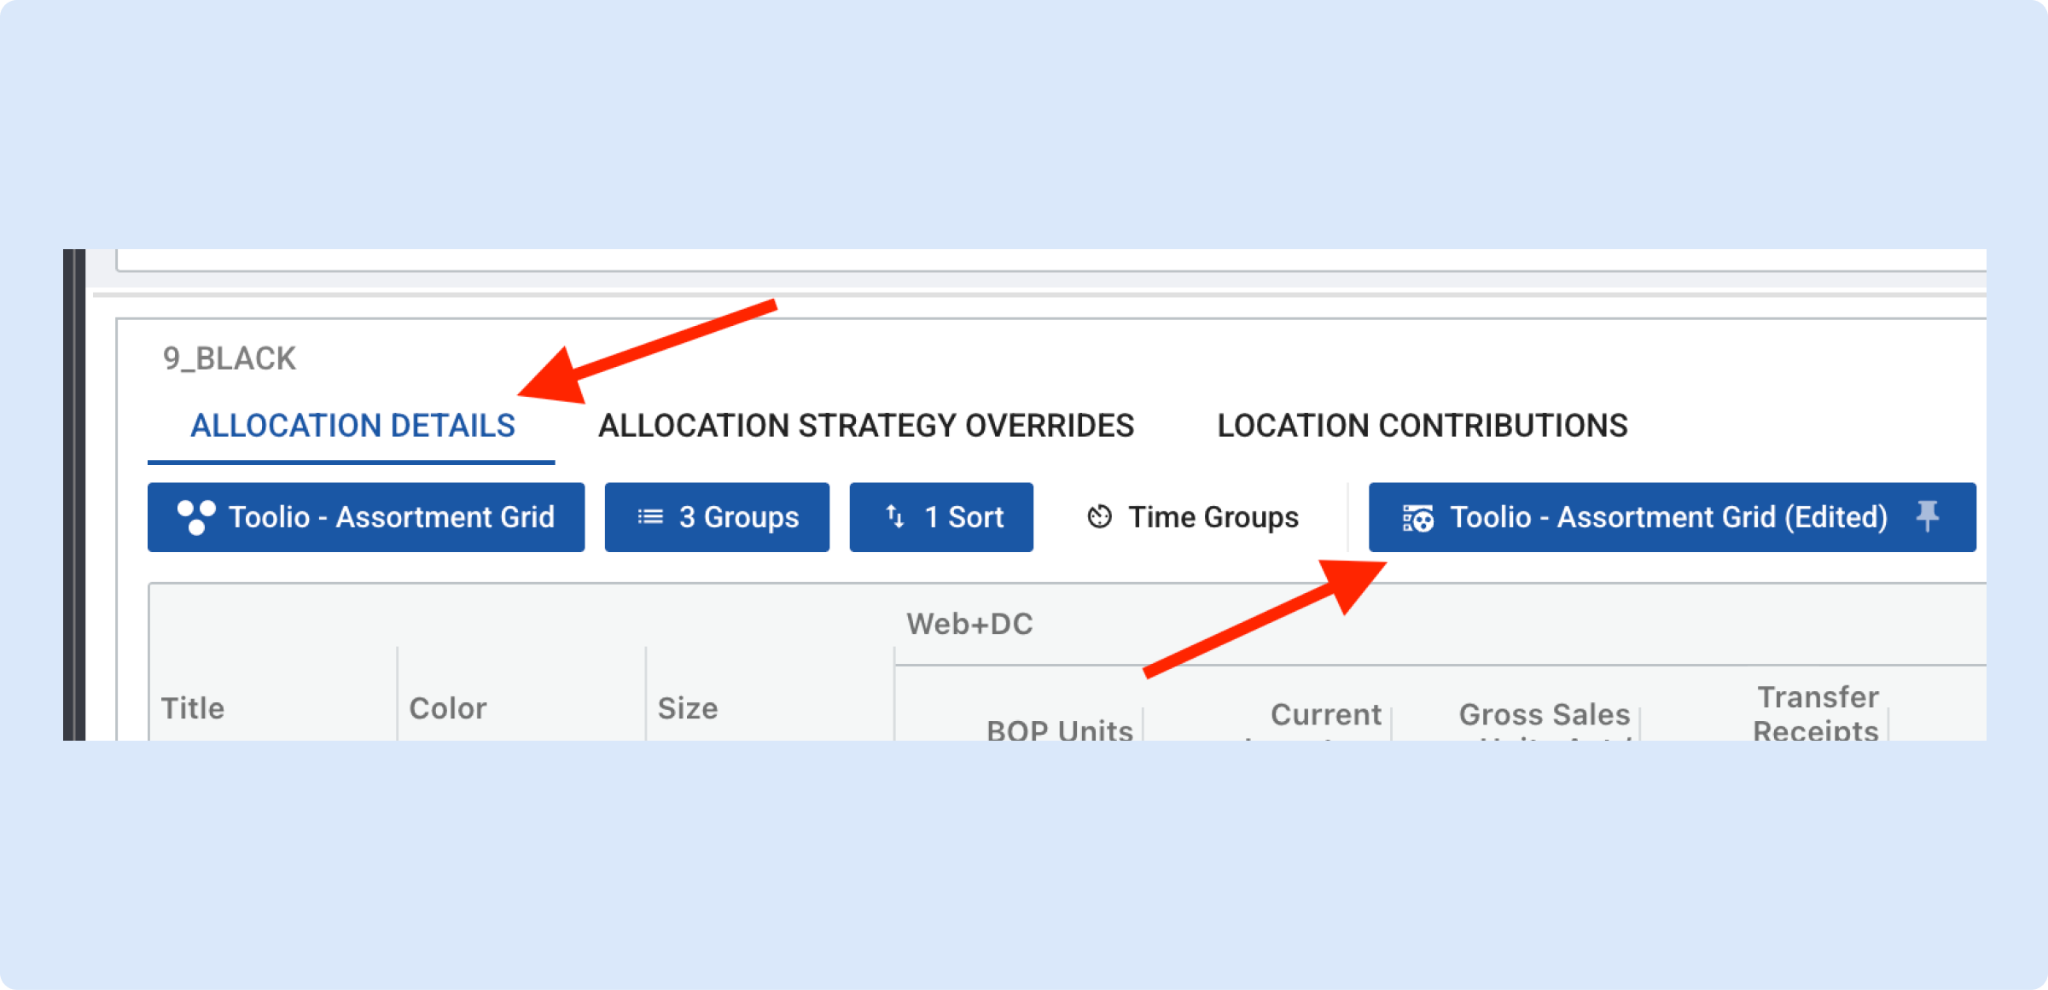
Tooli’s view building now covers the Assortment Plan grid and a choice’s Metrics tab, on top of the Merchandise Plan, Allocation, and Assortment Plan Reporting screens it already handled. Describe the metrics, grouping, and time grain you want and Tooli saves the view and hands you a link that opens it. You can refine it in the same conversation — add a metric, change the grouping, rename it — without disturbing your column widths or pinned columns.
👉 You can already ask Tooli to build and manage your saved views on Merchandise Plan, Allocation and Assortment Plan Reporting. That now covers the Assortment Plan grid and a choice's Metrics tab too.
Allocation
🗂️ Datasets in the Allocation Details Panel
The Allocation Details panel now has a dataset selector that shares its saved filter-and-timeframe datasets with the Allocation Plan page, so you no longer rebuild filters each time you open it. Datasets saved in either place show up in the other, and you can pin a dataset to a saved view so it always opens with the right filters and time frame. Whichever dataset you pick, the panel stays scoped to the strategy you drilled into.
👉 Read more in Allocation Module Views and Data Sets
🏷️ Promotional Causals in Allocation
Allocation Details now flags which weeks have an active promotional causal driving the sales plan — the same marker you know from Assortment Planning — so you don't have to switch screens to understand why a week's plan looks the way it does. Hover a marked week to see each promotion's name, the weeks it covers, its lift and discount, and how it's applied, or open the promotion directly to adjust it. The flag reflects exactly the promotions the allocation forecast applied for that choice and its locations.
👉 Read more about promotional causals
Lock Seeding: protect your allocation work when re-seeding
A new Lock Seeding checkbox at the Allocation Strategy level protects your locations, minimum presentation, safety stock, curves, and profiles from being overwritten when a choice is re-seeded from the Assortment Plan. Seeding now previews what will happen — for example, 1 new, 1 updating, 1 locked — before you confirm, and locking freezes only the strategy settings so your sales plan keeps refreshing on each run. Allocators no longer risk losing their setup every time a plan is re-seeded.
General Platform Updates
Hide Gridlines
You can now turn off a grid's default gridlines for a cleaner, spreadsheet-free look, and the setting saves with your view so it returns every time — for you and anyone else who uses that view. Any column borders you added yourself stay visible; only the default lines are removed. The Column Resizing menu is now called Grid Options and holds both the resizing actions and the gridlines toggle.
👉 Read more in Customizing Views
🪟 Create and Manage Your Views by Asking Tooli
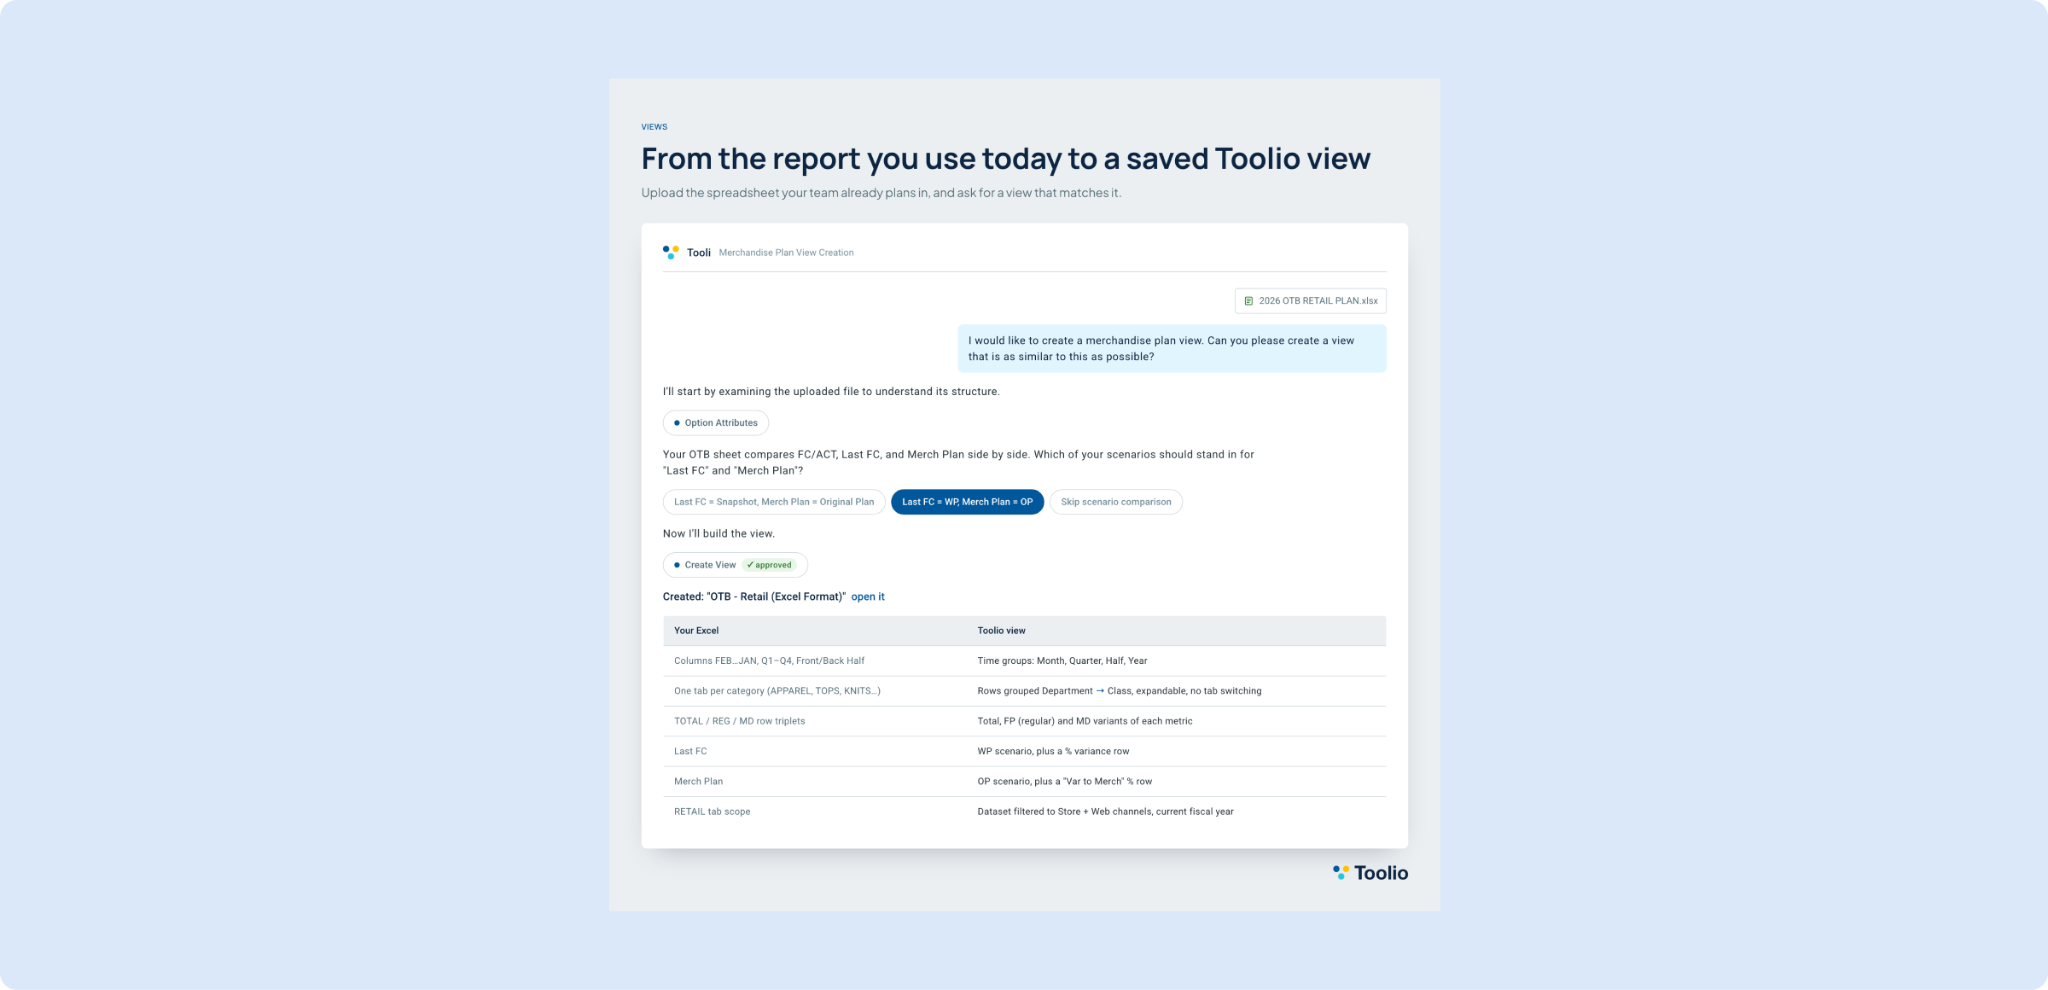
You can now describe a report to Tooli — the metrics, what goes on rows and columns, the time grain, and filters — and have it built and saved as a Merchandise Plan or Allocation Plan view, or upload a spreadsheet and ask for a view that mirrors it. Tooli reads the layout, maps columns to metrics, and tells you anything it couldn't match, and you can keep refining in the same conversation. It targets the long-used spreadsheet report that no system ever quite replicated.
💡 Product Tips on Loading Screens
Toolio now shows a short product tip while your data loads — a small card teaching a shortcut or feature you may not have found, like ⌘K navigation or Quick Filter. Tips only cover the modules your organization uses and only appear on longer loads, one per load, and admins can turn them off under Settings → Configuration → Organization Settings. It turns idle loading moments into a way to discover features without reading docs.
🎨 Highlight Whole Rows by Grouping Level
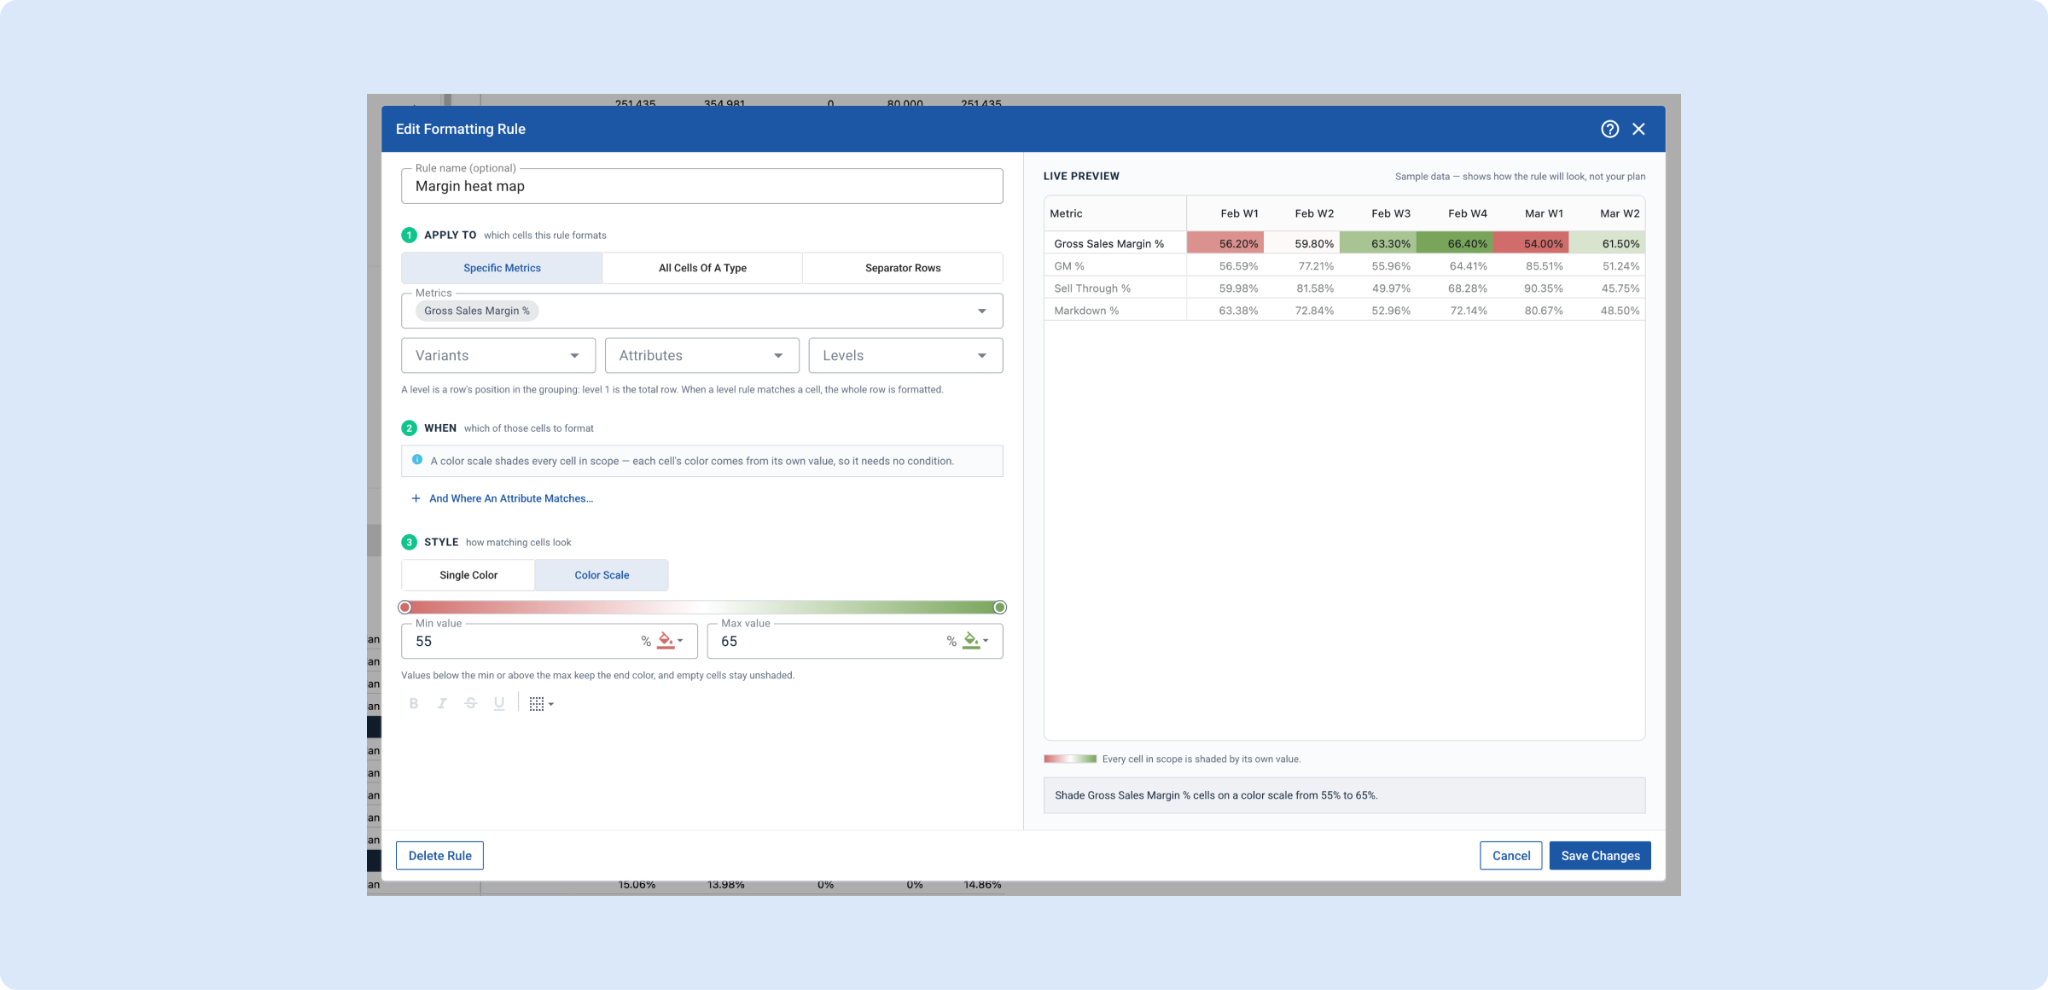
Conditional formatting rules can now target specific row-grouping levels (1 through 5), and a rule that matches a level fills that entire row across every column instead of just the triggering cell. You can make a whole tier — say every Division row — stand out while leaving the total row and Department rows untouched, and combine Level with Metric, Variant, or Attribute to narrow it. Because a level is a position rather than an attribute, the rule keeps working even if you change your grouping.
👉 Read more in Adding & Managing Conditional Formatting Rules
📌 Create Dashboard Widgets by Asking Tooli
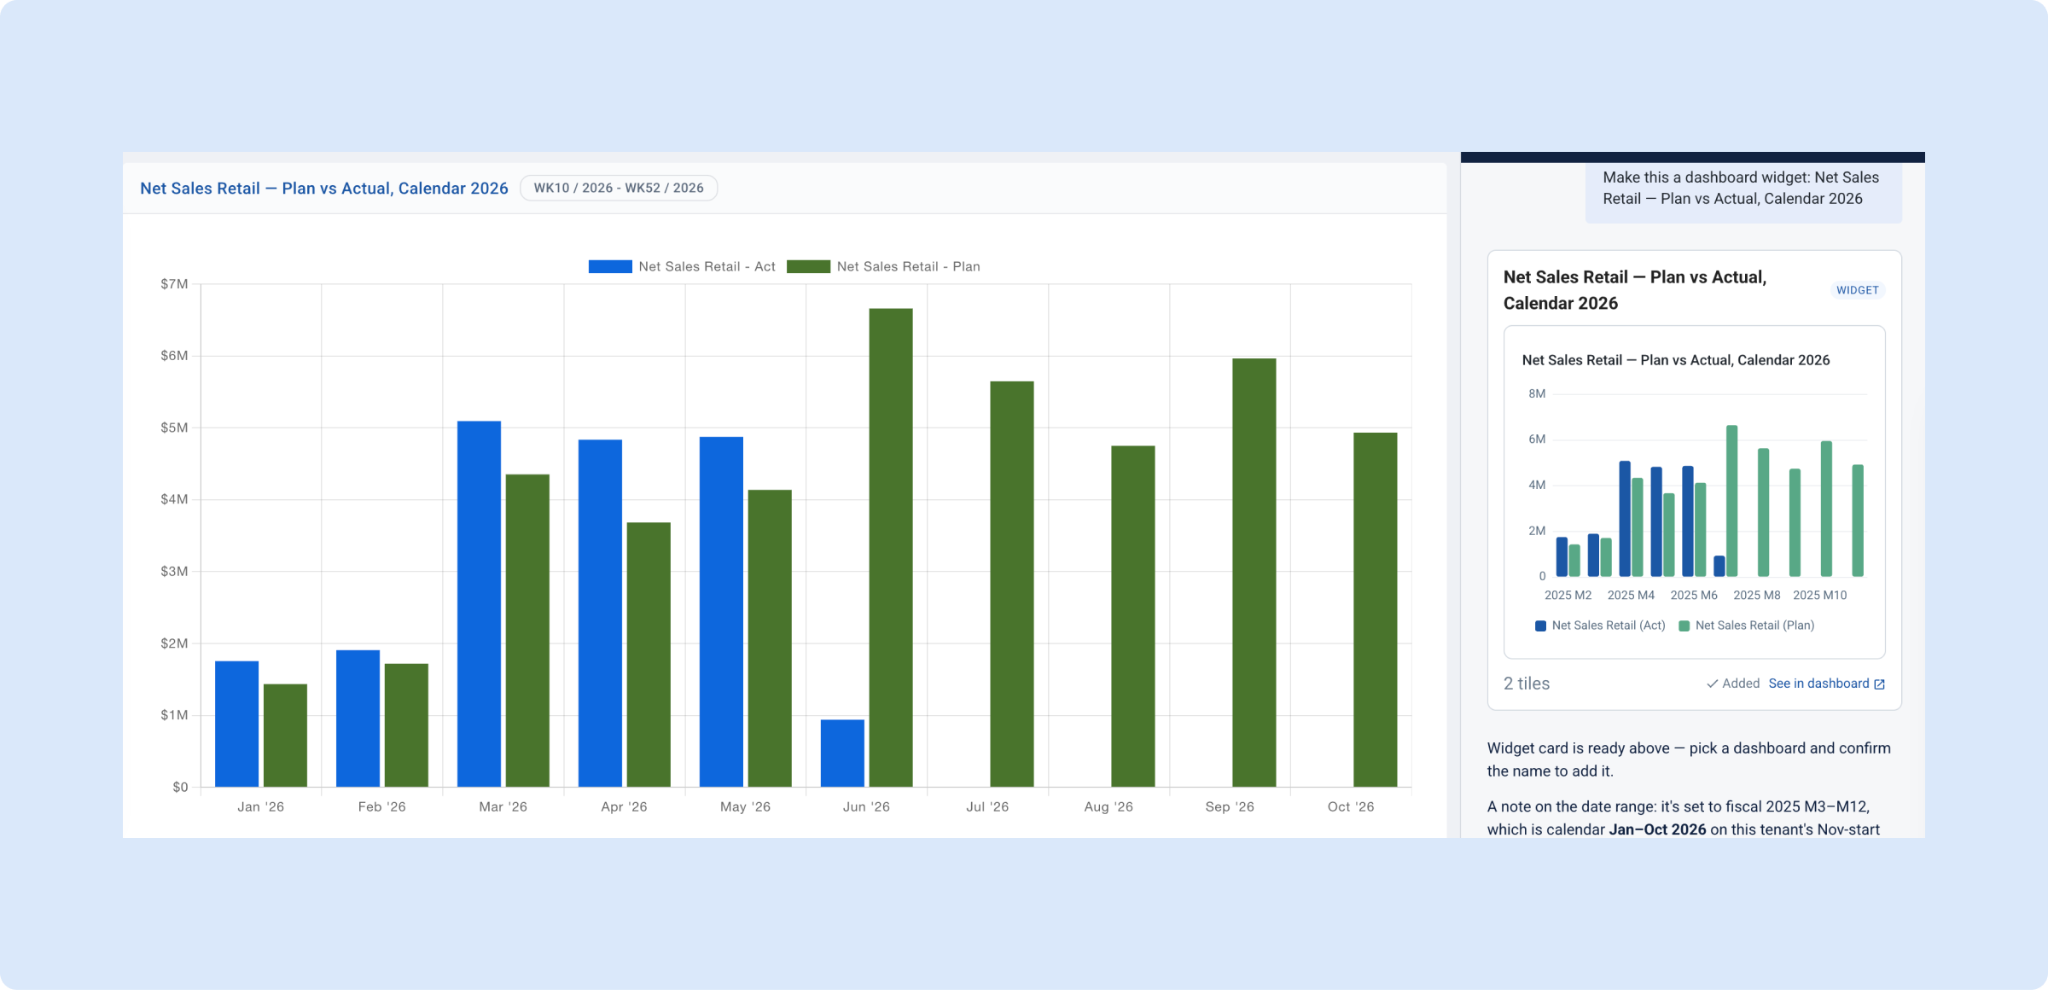
Ask Tooli for a number or chart and you can drop it straight onto a dashboard without rebuilding the query by hand. Tooli shows a preview card with the widget's metrics, periods, and data, and nothing is saved until you choose a dashboard, name it, and confirm — or you can pin a figure Tooli already answered with in chat. A single widget can cover several periods at once.
👉 Read more in Creating Dashboard Widgets with Tooli
🎛️ Dashboard-Level Filters
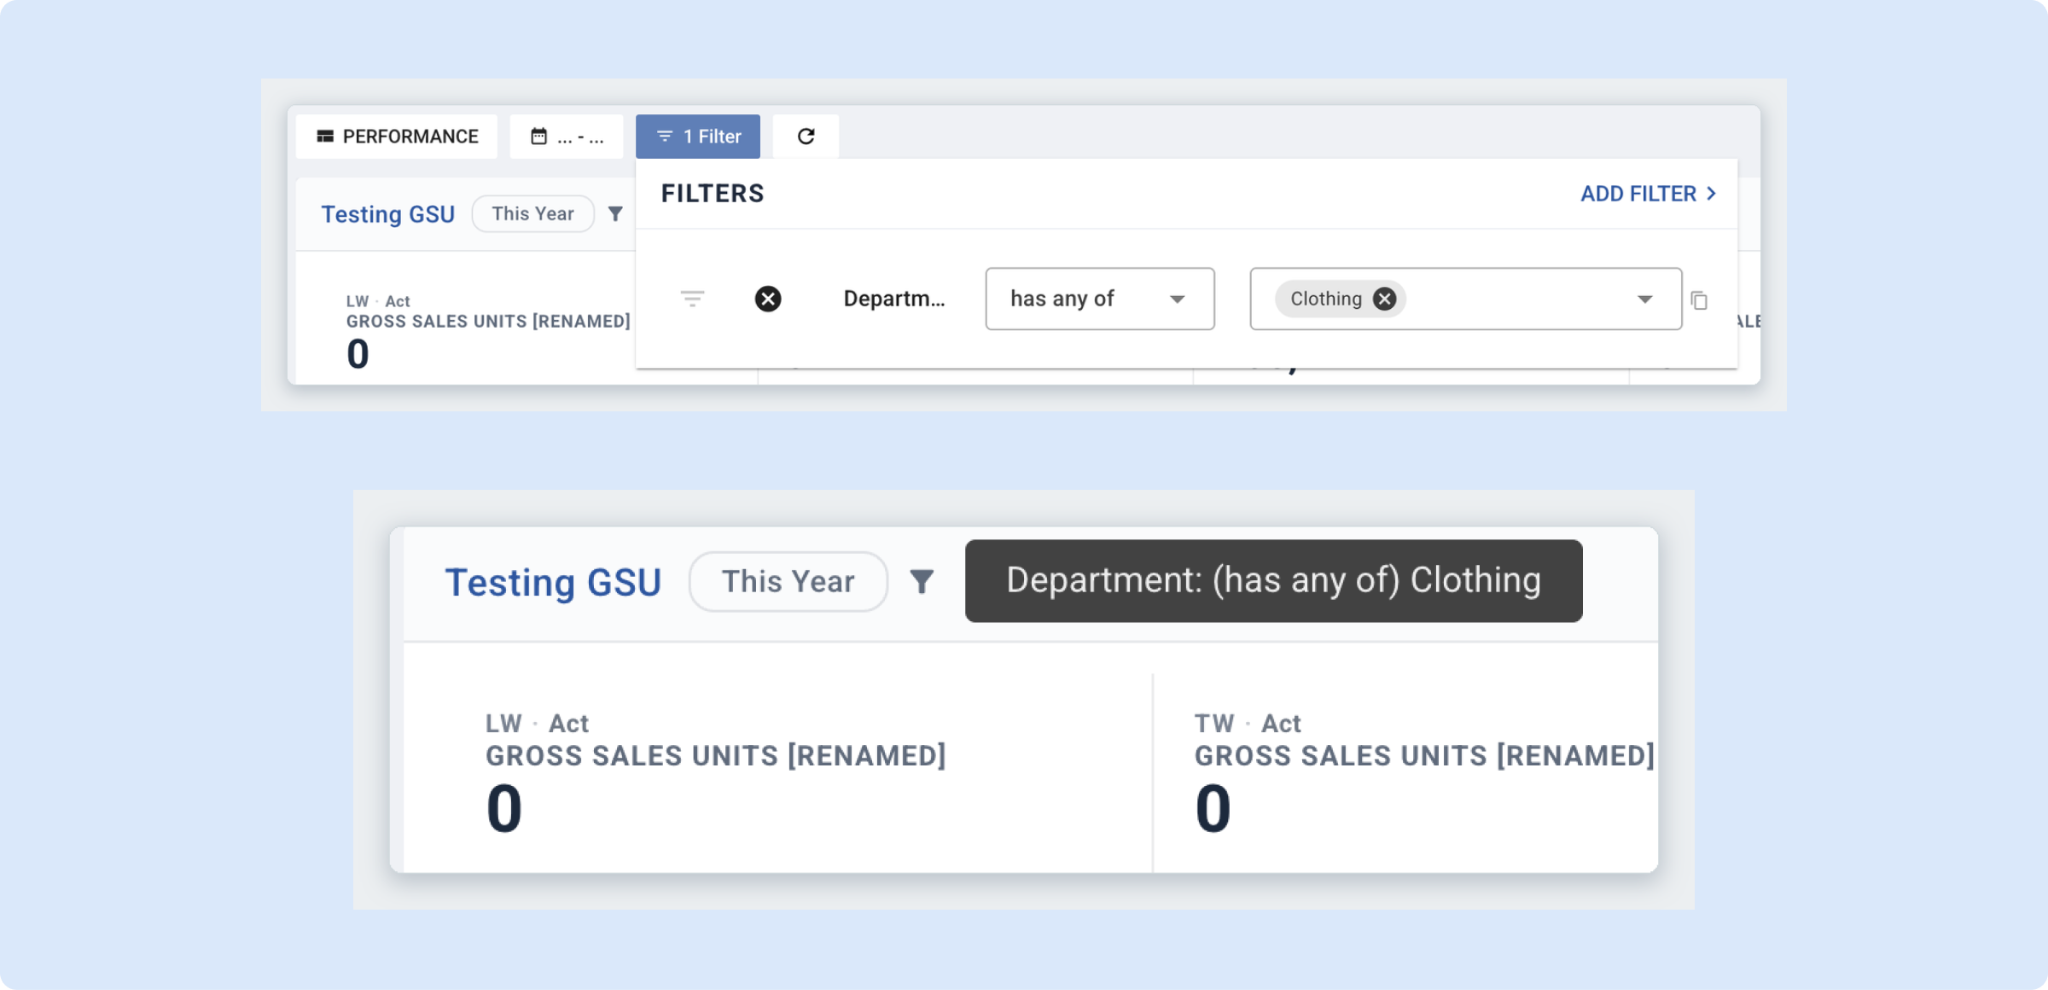
Dashboards now have a filter in the toolbar next to the time frame selector: pick an attribute like Department, Class, or Channel once and every widget on the board follows, instead of editing each widget's filters one at a time. You can filter on several attributes, use has any of or has none of, and share the narrowed board by copying the URL — the filter travels with the link. Each widget shows whether it applied the filter and flags any that couldn't.
👉 Read more in User-Created Dashboards
🔗 Share a Tooli Conversation
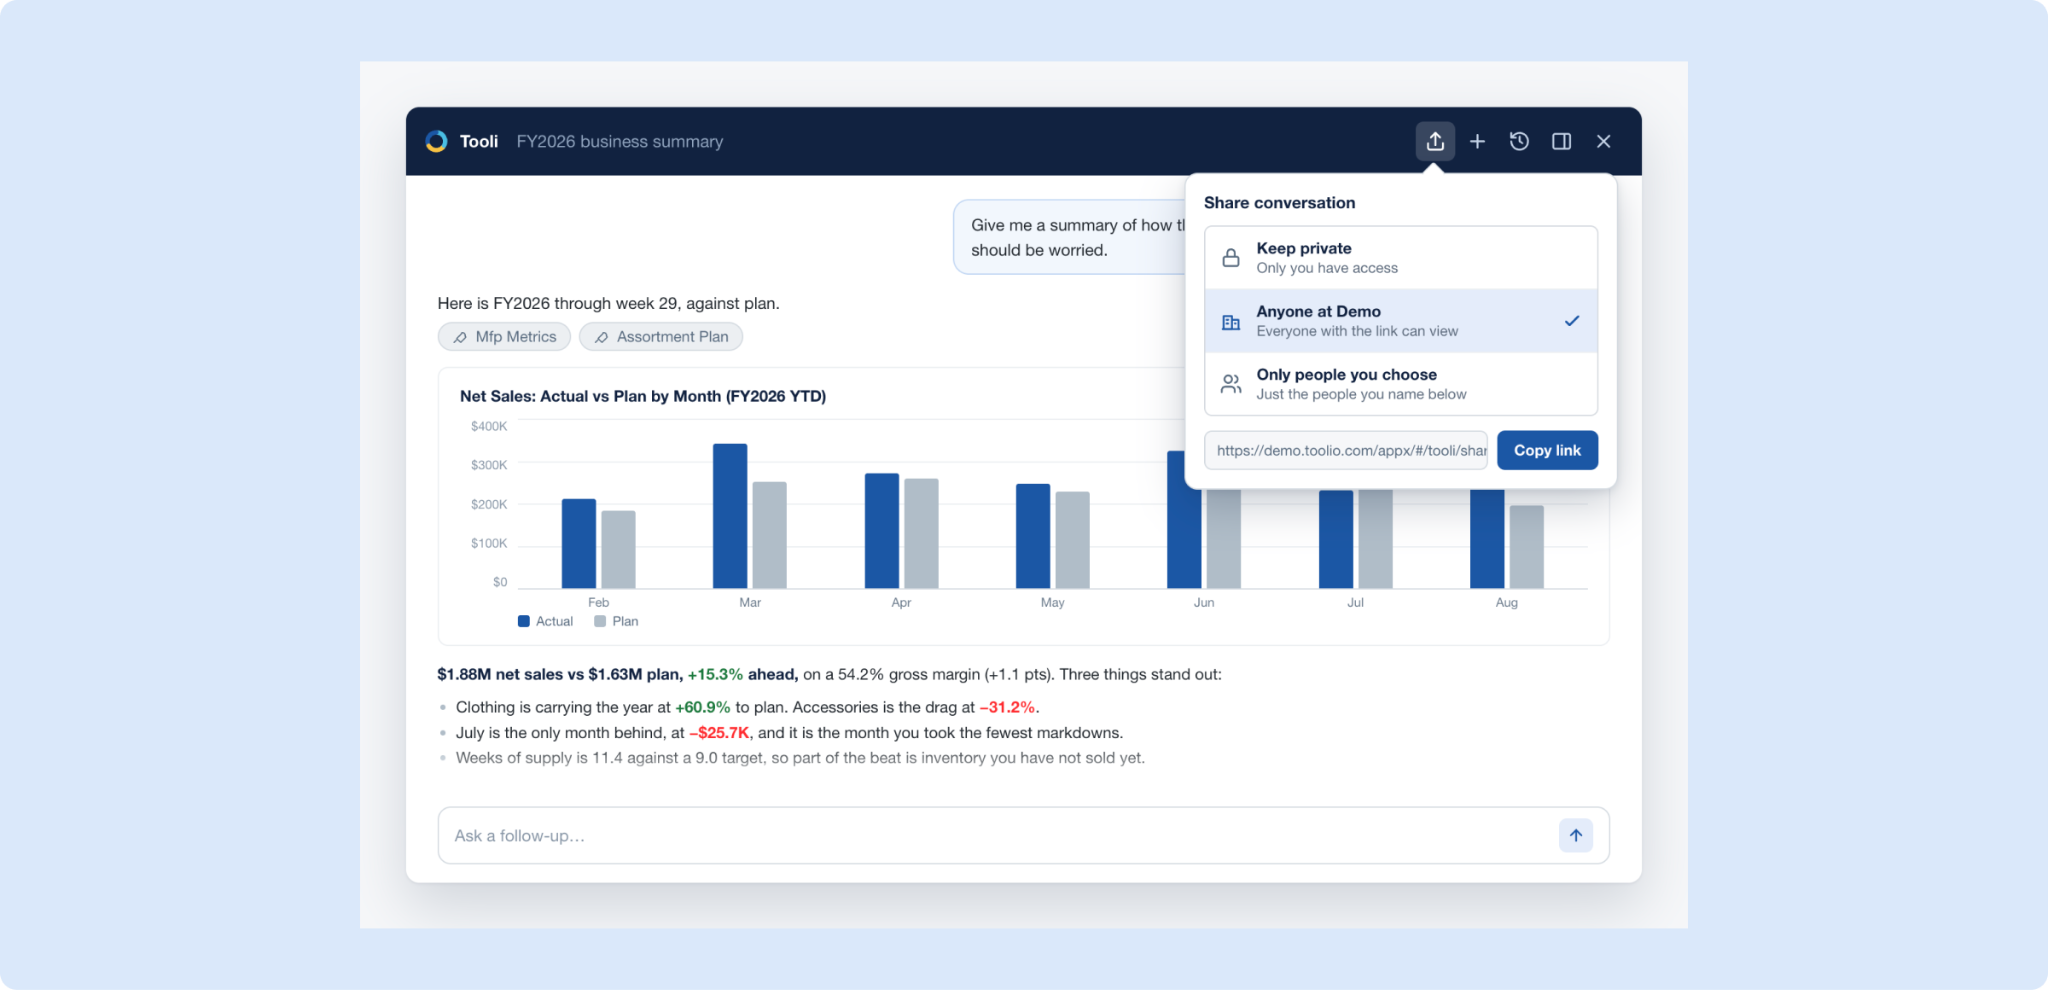
You can now share a Tooli conversation with a link, so a teammate sees the whole thread — your questions, Tooli's answers, and any charts or grids it produced — without being able to change anything. Choose whether anyone at your organization or only named people can open it, and revoke access at any time by setting it back to private. It lets you send the reasoning behind a number instead of re-explaining or screenshotting it.
👉 Read more in Sharing a Tooli Conversation
Module-Specific Data Scope
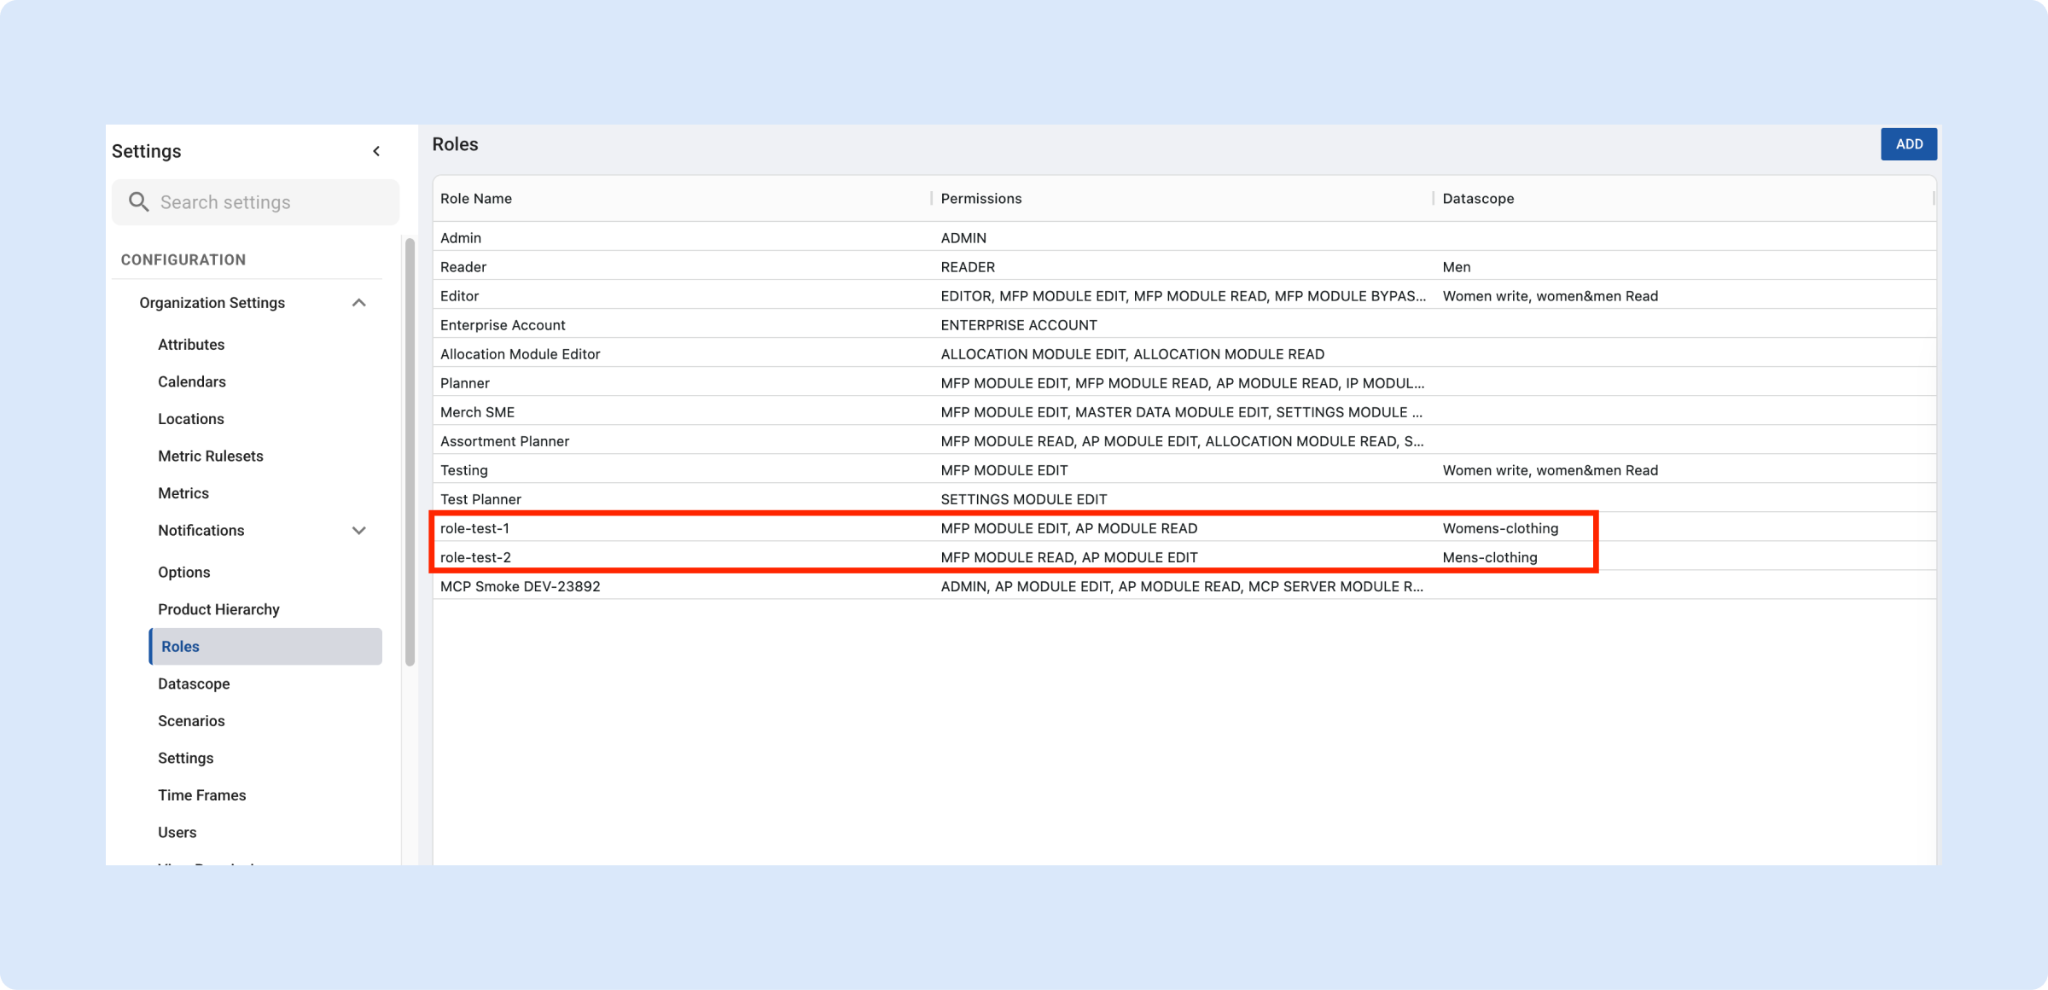
You can now assign multiple roles to the same user, with each role carrying its own module permissions and its own Data Scope, so access is tailored to both the module and the part of the product hierarchy. For example, one person can have Edit access to Women's Clothing in MFP and Edit access to Men's Clothing in Assortment Planning through two roles at once. It grants exactly the access someone needs without over-broadening a single role.
👉 Read more in User Management: Roles and Access
📊 Usage: see who is actually planning in Toolio
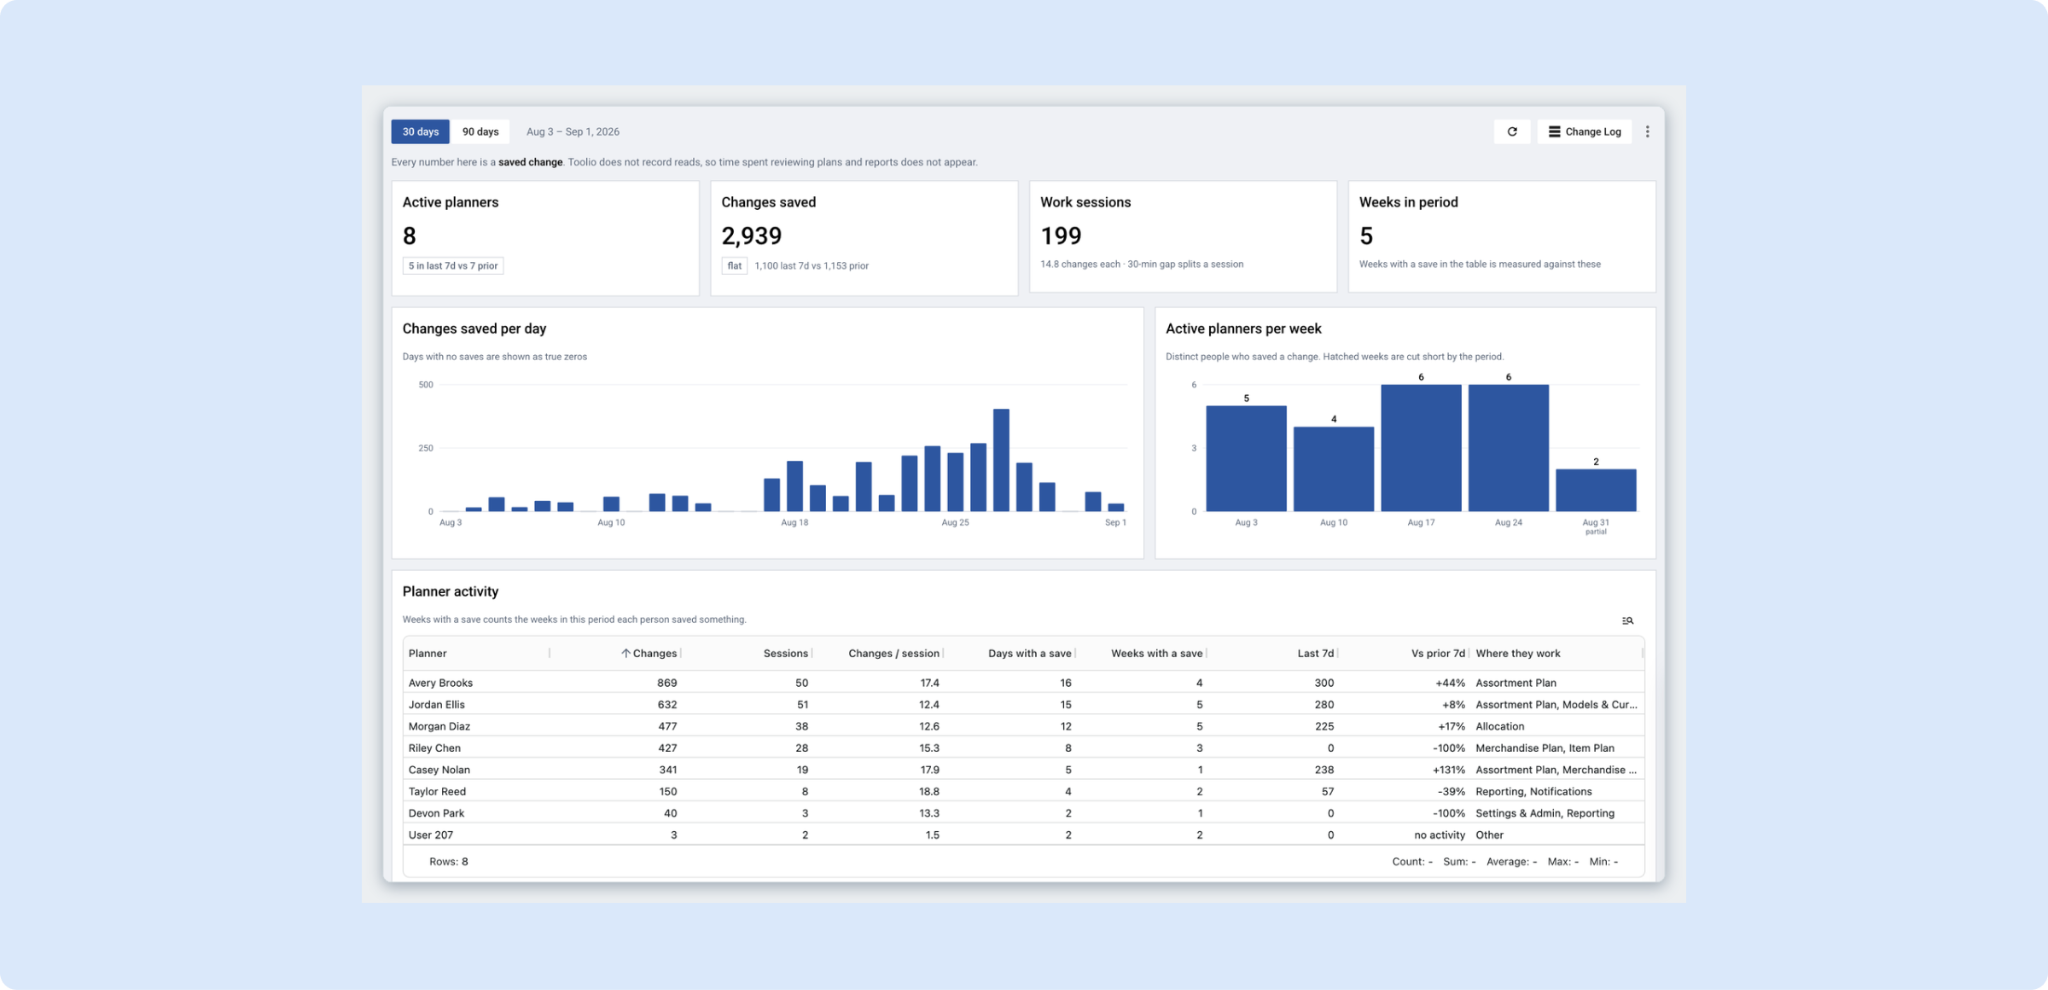
Change History now has a Usage view — a read-out of your team's planning activity over the last 30 or 90 days, built from the change events Toolio already records, with no setup required (Settings → Data Management → Change History → Usage). See how many people saved work, how often they return, changes saved per day and active planners per week, and compare planners side by side on changes, sessions, and the modules they spend time in. It also surfaces which modules are actually used, including any sitting at zero.
🎨 Conditional Formatting Rules, Rebuilt
The conditional formatting rule builder has been rebuilt into three clear steps — which cells to format, when, and how they should look — with a live preview that lights up matching cells and dims the rest as you go. A plain-language sentence reads the finished rule back to you, and you can now duplicate a rule instead of rebuilding it. It's in the same place, under Conditional Formatting in the View menu.
👉 Read more in Adding & Managing Conditional Formatting Rules
🏷️ Ask Tooli About Your Dynamic Groups
Tooli can now read the dynamic groups you’ve configured, so you can ask which group a value sits in, what rolls up under a group, or how a saved view or rule is grouped and filtered — right in the chat. Because the same value often sits in different groups across groupings, Tooli returns all of them rather than just one, and it can count what landed in Other. It saves digging through grouping settings to trace where a department or attribute rolls up.
📊 Tooli Builds Your Presentations
Ask Tooli to analyze your Merchandise Plan, then ask it to turn those insights into a presentation, and it hands you a downloadable PowerPoint right in the conversation. Want a different cut, fewer slides, or an extra section? Ask and Tooli rebuilds the deck. Recurring reviews that used to take real time to assemble now come together in the same chat where you run the analysis.
📦 Hierarchy Summary: A Single Page for a Category
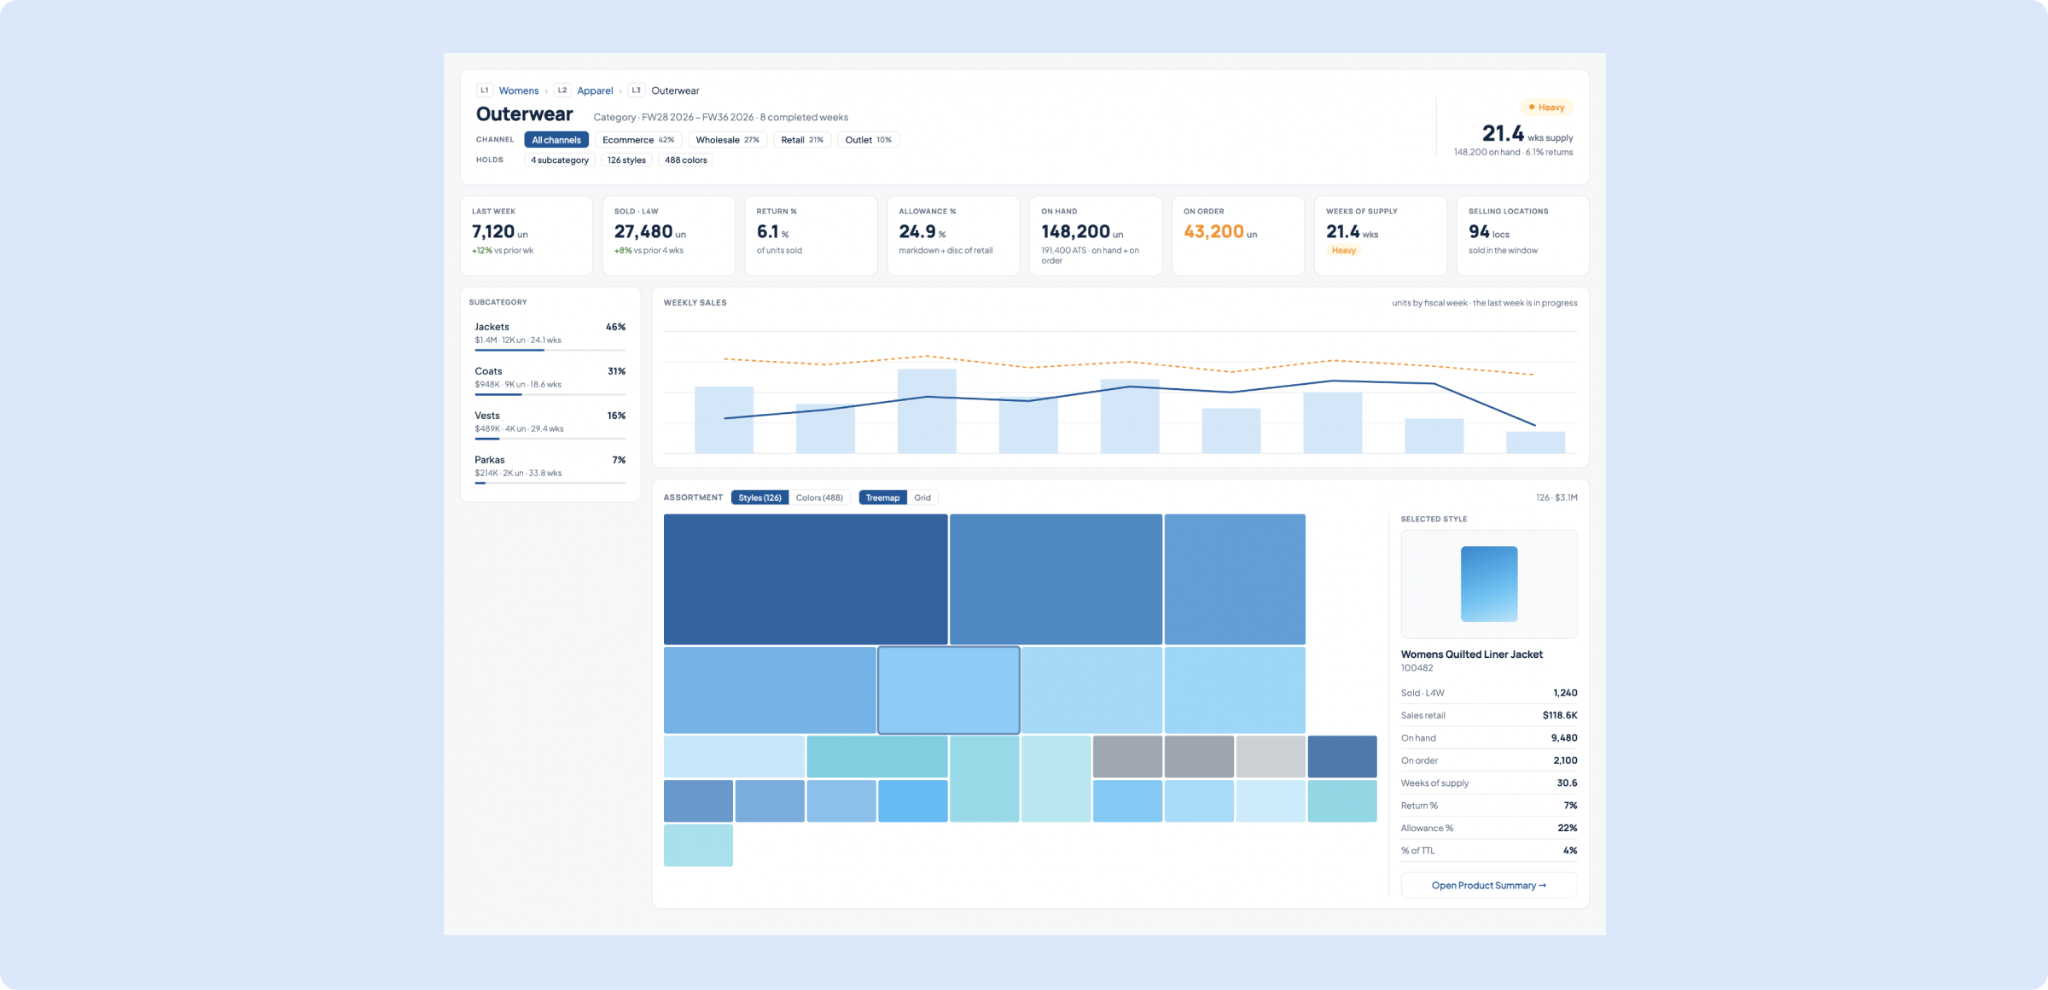
Pick any level of your product hierarchy from the command bar (Cmd+K) and see how it’s trading on a single screen — sales, inventory, weeks of supply, and every product underneath it — without building a view or filtering a plan. You can filter the whole page by channel, and a treemap sizes every style by its contribution so you can see what’s carrying the category. It’s a fast way to size up a division, department, or category at a glance.
Note: Hierarchy Summary is only available for customers that have Assortment Planning.
👉 You can read more about hierarchy summaries here
⌨️ Two faster ways to open Tooli
Tooli now has two new entry points: a keyboard shortcut (Cmd+J on Mac, Ctrl+J on Windows) that opens or closes it from any screen, and a round launcher button in the lower-right corner that you can drag to whichever corner you prefer. Both work everywhere, including while you’re inside a grid, so you can open Tooli mid-edit and ask about the numbers in front of you. The existing top-bar button is unchanged.
Need Help? We're Here for You!
Our support team is always ready to assist you. If you have any questions about these updates or need help getting started with new features, don’t hesitate to reach out!
Is there a feature you think would be a great addition? Let us know here!


